Self-Experiments in the Biochemically Unoptimized State
In search of biochemical correlates of fasting intolerance, and of paradoxical postprandial ketogenesis, lactate suppression, and protein-cured glucose intolerance.
As I wrote about in Getting to the Bottom of My Health: Biotin and (V)LCAD, last summer I decided to get very serious about biochemical optimization after a bout of stress- and undereating-induced peripheral neuropathy served as the straw that broke the camel’s back. This was the camel of my relative indifference toward my 20-year suspicion that I have underlying genetic impairments in my metabolism that are strongly affected by diet, yet which I still hadn’t gotten to the bottom of.
I drew my first labs as a series of blood nutrient concentrations from LabCorp on September 9 of last year. On September 18, I received them. They suggested to me that I was in a mildly biotin-deficient state, and that I perhaps had spent most of my life going in and out of various degrees of biotin deficiency depending on my diet and supplements.
As I wrote about in Getting to the Bottom of My Health: Biotin and (V)LCAD, labs that came in over the next several months ultimately led me to revise my hypothesis to include an impairment in one or both of two enzymes in fatty acid oxidation that might make me a candidate for high-dose riboflavin and/or for a low-fat diet supplemented with fatty acids of 8 or fewer carbons.
Since I now suspect there are several separate problems under the hood to deal with, I have titled this “Self-Experiments in the Biochemically Unoptimized State” rather than “. . . in the Mildly Biotin-Deficient State,” to leave open the final conclusions until my investigations are finished.
Herein, I document the self-experiments I did at home during this period, looking for the correlates of my apparent intolerance of fasting and undereating, and for biochemical evidence of biotin deficiency, such as paradoxical postprandial ketogenesis, where ketones rise in response to eating carbs, and glucose intolerance that is otherwise prevented by co-ingestion of protein, which I believe would occur in biotin deficiency for the reasons I described in High Protein? You Need More Biotin.
As you read this, you might ask yourself, “Why did he bother with all of this? Why not just supplement biotin?”
There are several reasons:
There isn’t any direct evidence in the literature that biotin levels towards the bottom of the normal range cause problems. There also isn’t any reason to doubt that they do, and most likely my biotin levels had been much lower in the past. But if I could show that I had biochemical abnormalities fixed by biotin, this could serve to make me more confident as well as to convince others to look for low-normal levels of biotin and to take them seriously when found.
If my hunch was right that I had stumbled on something that so centrally explained the last 40 years of my health and was the holy grail of genetics I’d been imagining existed in the 20 years since my catastrophic collision with veganism, then I wanted to know as much as possible about this centrally important part of me.
The more convincing the data, the more motivated I would be to keep up my biotin supplementation in the future, or to keep up whatever other strategy my data would drive me toward, once I inevitably started questioning whether I really needed it at some point down the line.
Few people struggle with health issues that also have my nutritional biochemistry expertise and analytical strengths, so diving this deep into my own health using that expertise and analytical strength could offer unique insights that could be useful to others trying to help themselves or their clients and patients.
I thrive on experimentation and analysis. I am in my natural home when performing experiments.
This is a massive tome, and if your time is limited, you may want to skip to “The Bottom Line” below.
However, there are some major reasons to commit some time to this:
It serves as a crash course on the most relevant biochemistry of glucose, ketones, lactate, and ethanol across contexts that include general health, diabetes, infancy, and pregnancy.
It includes a literature review of all of the relevant “normal” data. For example, what usually happens to lactate during fasting? What is the normal response of ketones to a glucose tolerance test at the 15-minute mark? How high should you expect your lactate to go up when you drink vodka, bourbon, or beer?
I have laid out a model of self-experimentation that you can borrow from for your own experiments.
There are many thought-provoking nuggets in here. For example:
Is it possible that two pounds of extra body fat prevents peripheral neuropathy in me and perhaps others? I make the case that it may.
Has your fasting glucose gone up on low-carb? See why mine went down after doing repeated glucose tolerance tests on myself (which I don’t recommend at home!)
And, learn why I can fast my way to a glucose of 70 or eat my way to a glucose of 70 and I would choose eating my way there every time.
In This Article
In this article you will find the following:
The Initial Observation Period
What’s With the Lactate?
My Response to Fasting
Paradoxical Postprandial Ketogenesis?
What Is Paradoxical Postprandial Ketogenesis?
Is This Short-Lived Rise in Ketones Normal?
Did I Have Paradoxical Postprandial Ketogenesis?
Protein-Mitigated Glucose Intolerance?
Did Carbs Paradoxically Suppress My Lactate?
My Randomized Controlled Trials
General Methodology
Four Hypotheses to Be Tested
Trial 1: My Ketone Response to Rice
Secondary Endpoint: Did Rice Suppress My Lactate?
Trial 2: My Neurological Response to Fasting
Was Body Fat Curing the Tingling and Numbness?
Nested Observation: The Paradoxical Rise and Fall of Lactate
Trial 3: Protein and Glucose Tolerance
Results of the First Glucose-Protein Trial
The Adaptation to Repeated Glucose Tolerance Tests
The Second and Final Protein-Glucose Trial
Did Glucose With or Without Protein Suppress My Lactate in the Morning?
Waking Values of Glucose, Ketones, and Lactate During Adaptation to Repetitive Glucose Tolerance Tests
Adverse Effects of the Glucose Tolerance Tests
Conclusions From the Glucose Testing
The Final Experiment: Have a Beer With Masterjohn
Why Alcohol Raises Lactate
Is a Rise to of Lactate to 4 mmol/L After 1.5 Beers Normal?
Did the Beer Contribute to My Peripheral Neuropathy on August 10?
The Bottom Line
Moving Forward
Tools I Used For This Project
What Do You Think?
This Article Will Not Fit In Your Email
This article is too long to fit in your email and it is likely truncated. Please read it on the web site using the share button:
Diving In…
With all that said, here is the story and the results.
I started by collecting some observations over the course of the first week, then used these observations to form my key hypotheses and to design randomized controlled trials to perform on myself in the style I described in How to Do a Proper Self-Experiment And Why Your N Doesn’t Technically Equal 1. Then, these experiments culminated in the final observation day where I tried to as closely as possible replicate the event that rose my concerns last summer in the live Have a Beer With Masterjohn video.
The Initial Observation Period
The event that had concerned me the most was the one I described in Getting to the Bottom of My Health: Biotin and (V)LCAD, where my feet and hands started tingling while having a beer with friends around 7 PM after having only eaten a salad with eggs around 4PM.
While I months later tried to replicate that scenario with much greater precision, my first question was whether I was becoming hypoglycemic in the evening if I went too long without eating.
On Monday, September 24, I waited five hours after my lunch until 7:21 PM and then checked my glucose. Since I had a KetoMojo, which measures both glucose and ketones, I measured both. My glucose was 85 mg/dL and my ketones were 0.8 mmol/L. Then I measured my urine pH, which was 5.0. My urine was much more acidic than it should have been (6.4-6.8 would be ideal) and my ketones seemed rather high for not intentionally being on a ketogenic diet.
What’s With the Lactate?
However, I then realized that since I had a lactate meter to monitor my zone 2 workouts, I could measure my lactate as well. This would allow me to see whether ketones or lactate could better explain why my urine was so acidic. My lactate came out at 1.6 mmol/L, which I marked with a “(???)” in my notes because it was way higher than I would have expected.
This lactate measurement seemed insane. In Adventures in Zone 2 Cardio Training: Part 1, I covered my previous lactate measurements. My baseline lactate was always 0.5-0.9, most commonly 0.7.
1.6 was right in the middle of my 1.5-1.7 active lactate during my zone 2 workouts!
So all this hullabaloo I was making out of driving my lactate up to 1.5-1.7 for an hour using exercise could be achieved simply by undereating into the evening?!
I usually did my workouts in the morning. Maybe lactate typically rises at night? Probably not. In meta-analysis, lactate runs slightly higher in the morning without clear evidence of a circadian effect.
Maybe lactate typically rises during fasting? That seemed nearly impossible to me, since it is a product of glucose metabolism and glucose availability is higher after eating. Perusing pubmed quickly showed that what seemed obvious was true, across almost any context. For example, here is the lactate response to a standardized mixed meal with cod for protein (left) or beef for protein (right), before (dotted) and after (solid) four weeks of consuming that protein source habitually:
This is lactate during Ramadan, when Muslims fast until sundown:
The first and second measurements are taken two hours apart, before and after the evening meal at the beginning of Ramadan. The third and fourth are the same, but toward the end of Ramadan. The fifth is morning fasting lactate after Ramadan is over. Thus, lactate is lowest when fasting into the evening, highest when having eaten, and in the middle after an overnight fast.
This is blood lactate after 12, 36, and 72 hours of fasting, where the three types of bars represent the whole group, the men, and the women, and the three groups of bars represent each of the three time points. It basically goes nowhere:
I then went back to my spreadsheet of zone 2 workouts and discovered an anomaly:
Most of my fasting workouts were done in the morning, and they all had resting lactates of 0.7-0.9.
My lowest resting lactate was 0.5, on a day where I had 60-70 mL of fasting blood drawn, then ate breakfast, then did my workout at 2:19 PM.
My highest resting lactate was one that never made it into my Zone 2 article because it was my first time using the meter and I got a bunch of errors while I was trying to take measurements during exercise. That was also the latest fasting workout that I did. It was done at 12:25 PM and my lactate was 1.2 mmol/L.
While the sample size there was extremely limited, it was consistent with a paradoxical rise of lactate in the fasting state. My lowest resting lactate reading was after eating breakfast, and my highest was when fasting into the afternoon.
The trend wasn’t perfect: my second-latest fasting workout was also done after the clock struck noon and the lactate was only 0.9, but even that was at the top of my “normal range.” Also, I had a couple drinks and went to bed late the night before the 1.2 measurement, but did not have drinks and slept well the night before the 0.9 measurement. Thus, the 1.2 measurement may have resulted from the combination of fasting until noon and having other stressors on my metabolism the night before.
In other words, my normal morning fasting lactate at this time may have been 0.7, but it could be suppressed to 0.5 by eating, and fasting until after the clock struck noon would add 0.2-0.3 points while having drinks the night before could also add 0.2-0.3 points.
I then opened up my copy of Inherited Metabolic Diseases and re-read the chapter on genetic defects in the biotin-dependent enzyme pyruvate carboxylase.
I remembered from this that pyruvate carboxylase deficiency causes paradoxical postprandial ketogenesis (a rise in ketones in response to carbohydrate), but I couldn’t remember what it did to lactate in the fasting and postprandial states.
And that’s where I found this:
Typically, blood lactate increases in the fasting state and decreases after ingestion of carbohydrate.
Thus, deficiency of the biotin-dependent enzyme pyruvate carboxylase causes a paradoxical rise in fasting lactate and a paradoxical postprandial suppression of lactate.
Why?
Because pyruvate carboxylase is needed to make oxaloacetate, which is converted to aspartate with the help of vitamin B6. Aspartate is needed for the malate-aspartate shuttle, which transports electrons from NADH in the cytosol to NADH in the mitochondrion.
The cytosol is the main compartment of the cell and is where glycolysis — the breakdown of glucose — takes place, while the mitochondrion is a specialized structure often dubbed the “powerhouse of the cell.” It is in the mitochondrion where the respiratory chain uses oxygen from the air we breathe to make ATP, the basic energy currency of the cell. This is fueled by electrons taken from food in such processes as glycolysis, carried by such molecules as NADH.
NADH can be seen as a bus, NAD+, that carries electrons as passengers. When the bus is empty, it is NAD+. When the bus is full, it is NADH.
Glycolysis removes electrons from glucose as it rips it in half to form two molecules of pyruvate. These electrons need to be loaded on the NAD+ bus to form NADH. NADH needs to shuttle its electron passengers to the mitochondrion so that the empty bus, NAD+, can come back to glycolysis and keep it running.
The electrons move from glucose to cytosolic NAD+, forming NADH. Then they move from cytosolic NADH to the malate-aspartate shuttle, reforming cytosolic NAD+. Then they take the shuttle to mitochondrial NAD+, forming mitochondrial NADH. Then they are delivered to the respiratory chain, reforming mitochondrial NAD+. The respiratory chain uses them to make ATP. The regeneration of cytosolic NAD+ allows glycolysis to continue running and the regeneration of mitochondrial NAD+ allows the mitochondrial systems to continue running.
Without the malate-aspartate shuttle, those electrons get stuck in the cytosol, and the only way to remove them is for NADH to dump its electron passengers onto pyruvate, forming lactate. This converts NADH to NAD+ and allows glycolysis to continue running.
However, this comes at the expense of greater acidity in the cytosol, requiring the lactate to be consumed by nearby cells (for example, slow-twitch muscle fibers consume it when fast-twitch muscle fibers make it; neurons consume it when astrocytes make it), or delivered to the liver to be converted by to glucose in the Cori cycle, which happens during high-intensity exercise and creates a major energy deficit in the liver that must be made up for during rest.
Ordinarily, lactate rises during exercise because the demand for glycolysis is exceeding the capacity of the mitochondrial respiratory chain to use oxygen to oxidize NADH to NAD+. I covered this in Lesson 15 of my Energy Metabolism class.
However, pyruvate carboxylase deficiency raises lactate because there is not enough aspartate to move electrons from cytosolic NADH to mitochondrial NADH, making the oxygen in the respiratory chain helpless and irrelevant.
The reason this is worse in the fasting state is because when you eat, you consume the following:
Aspartate, in the protein you eat.
Other amino acids that I dubbed “biotin-sparing” in High Protein? You Need More Biotin, which can be converted to aspartate through the citric acid cycle.
Glucose, which, if there is any residual pyruvate carboxylase activity, can generate some aspartate, even if the amount it can generate is much less than it would be with normal pyruvate carboxylase activity.
With that said, it seems more obvious to me that protein would suppress lactate than that glucose would. Even if glucose can generate some aspartate, it will generate even more flux through glycolysis, and if pyruvate carboxylase is deficient it is hard to imagine the rise in aspartate after consuming glucose alone would be sufficient to handle the increased load of pyruvate.
I tried chasing down the references from the textbook, and could not find anything demonstrating lactate going down after carbohydrate administration.
Now that I am writing this article, I found one paper from 1977 addressing this. A pyruvate carboxylase deficiency patient had very elevated fasting lactate, at just under 8 mmol/L. However, an intravenous bolus of glucose caused lactate to rise further, not fall. It did, however, cause her total ketones (acetoacetate plus beta-hydroxybutyrate) to rise from 1.5 to 2.6 over the course of 5-10 minutes, after which they began falling at some unmeasured point prior to 30 minutes. While she was in the hospital, her lactate was highest when being fed regularly with intravenous glucose, and was lowest when fed the largest amount of protein. Unfortunately, she died at home when she was 14 months old as a result of metabolic acidosis.
Thus, I believe my biochemical reasoning above is better supported than the statement from the textbook: that pyruvate carboxylase deficiency can cause lactate to rise in the fasting state because the protein needed to provide an alternative source of aspartate is depleted.
I must temper this by realizing that many such statements may be drawn from clinical experience rather than the literature, but if it is not documented in the case report literature (as far as I have so far found) I am inclined to suspect that it could be derived from poorly controlled observations where a rise in fasting lactate and a paradoxical post-meal suppression of lactate could have been wrongly taken to implicate the carbohydrate in suppressing the lactate when the correct conclusion was that the protein suppressed it.
However, you will see below that I developed some evidence that under some circumstances, carbohydrate may play a role in suppressing my lactate, supporting the statement in the textbook.
My Response to Fasting
My next step was to examine my metabolic response to typical days eating regularly spaced meals and to days where I fasted until the evening, while looking out for signs the fasting could elicit peripheral neuropathy, and for opportunities to find postprandial ketogenesis and glucose intolerance that could be prevented by eating protein.
On Wednesday and Thursday of the same week, I fasted until after 4 PM and then tested my response to a bolus of carbohydrate.
On both days, I found that, while I was fasting, I could provoke the pins and needles in my hands and feet by sitting on my couch reading or by working at my computer in a chair, but that I would not be able to provoke this after I had eaten, and that I would not be able to provoke it if I sat outside in the sun and read in an active stance. The active stance is with erect posture and lightly driving my feet into the ground. I believe the active stance reduced the pressure of my butt against the chair I was using, and that eating provided my nervous system with the energy it needed to function normally even in the presence of the physical pressure caused by fully relaxed sitting.
Fasting also gave me mild short-term memory loss, made my brain feel hungry, and made me feel like I could take in information but not actively analyze it.
My fasting allowed coffee with stevia and cream.
My glucose was between 81 and 104 while fasting. My highest waking glucose was 96 and only one fasting measurement was higher than that, at 104. My glucose tended to go up and down through the fasting period with no clear direction.
Between waking and my last measurement after 4PM, my ketones rose from 0.4 to 0.9 on the first day, and from 0.3 to 1.1 on the second day.
I didn’t have lactate strips on the morning of the first day, but on the second day my lactate rose from 0.7 at waking to 1.1 at the last measurement.
Thus, the main changes during fasting were that my ketones and lactate rose. My ketones seemed higher than I would expect for not being on an intentionally ketogenic diet, but the rise in ketones during fasting is completely normal while the rise in lactate during fasting is abnormal.
Paradoxical Postprandial Ketogenesis?
Since most people are unaware of the concept of paradoxical postprandial ketogenesis, it deserves an introduction here.
What Is Paradoxical Postprandial Ketogenesis?
Pyruvate carboxylase deficiency causes ketones to abnormally rise in all conditions including that of a high-carbohydrate diet, and causes ketones to rise after eating carbohydrate, which is the opposite of what should normally happen: normally carbohydrate suppresses ketones. Since it is the opposite of normal, it is called paradoxical. That is, pyruvate carboxylase deficiency causes paradoxical postprandial ketogenesis.
As explained in Lesson 32 of my Energy Metabolism class, the one, single, universal, and only proximate cause of ketogenesis is a rise in the ratio of acetyl CoA to oxaloacetate. Acetyl CoA is what you get when you break down glucose, fatty acids, and many amino acids for energy, and oxaloacetate is what you need to continue breaking down acetyl CoA for energy in the citric acid cycle. Without oxaloacetate, acetyl CoA condenses with itself to initiate the synthesis of ketone bodies.
The normal reason a rise in the ratio of acetyl CoA to oxaloacetate happens is that, during fasting or carbohydrate restriction, increased fatty acids are delivered to the liver, where beta-oxidation produces acetyl CoA from them, while oxaloacetate is used up by the liver to make glucose and export it to the rest of the body. Thus, the hepatic ratio of acetyl CoA to oxaloacetate shoots through the roof. The acetyl CoA has no oxaloacetate to enable it to enter the citric acid cycle, so it instead forms ketone bodies.
The roles of hormones such as insulin and glucagon are simply to communicate between tissues the supply of substrates and to facilitate the above process under conditions of low glucose.
In pyruvate carboxylase deficiency, the synthesis of oxaloacetate is compromised under all conditions, so ketones rise under all conditions.
The normal effect of carbohydrate is to generate as much oxaloacetate as is needed to allow any acetyl CoA present to enter the citric acid cycle. Hence, the normal effect of carbohydrate is to suppress ketogenesis.
In pyruvate carboxylase deficiency, when glucose is provided on its own, it generates acetyl CoA through pyruvate dehydrogenase (Lesson 13), but it cannot generate oxaloacetate. Hence, the ratio of acetyl CoA to oxaloacetate rises even above the fasting state and ketogenesis paradoxically increases.
According to the Saudubray textbook, there are three types of pyruvate carboxylase deficiency of different severities:
The most severe type (the “French phenotype”) is the one that most commonly demonstrates paradoxical postprandial ketogenesis, and usually leads to death soon after birth from lactic acidosis or at least by the age of five months from a respiratory infection.
The less severe type (the “North American phenotype”) causes acute illness starting at 2-5 months, leads to severe mental retardation and seizures, and generally causes death at some point during infancy.
The third and “more benign” of the three types is characterized by acute episodes of lactic acidosis and ketoacidosis, but does not lead to death. The consequences are variable across different individuals, and are mostly intermittent and episodic. They include problems with muscle tone, gait abnormalities, trouble speaking, seizures, and transient paralysis of one half of the body. Sometimes they include subcortical leukodystrophy, which is a defect in myelination that can manifest in various ways such as hearing loss, loss of muscle coordination, and adult-onset intellectual decline.
As an aside, the assumption that the first two types are a death sentence is based on early case reports where 10-20 milligrams of biotin did nothing to help. As I documented in When High-Dose Biotin Is Truly Needed, the fact that 1.2 grams of biotin per day can rescue the “lethal” and “biotin non-responsive” L216R mutation in holocarboxylase synthetase, the enzyme that adds biotin to all biotin-dependent enzymes, including pyruvate carboxylase, calls into question whether these pyruvate carboxylase mutations are actually intrinsically lethal or whether no one ever tried using a high enough dose of biotin.
If it is true that postprandial ketogenesis is typically seen in the most severe type, then I should not expect to see it in myself, since I obviously have not died soon after birth.
However, the 1977 case report I cited above seems to be a “North American” type, because she was born in Missouri, her serious health issues had an onset between three and five months, and she didn’t die until she was 14 months old. At approximately one year old, she was given an intravenous bolus of glucose that increased her total ketones from 1.5 to 2.6 mmol/L at the 5-minute and 10-minute marks:
Her results are the bottom line. The top is a “control” patient who we have to dismiss since he was being investigated for his abnormally high ketones. No measurements were taken between 10 and 30 minutes, so we can only say that her ketones started decreasing somewhere between 10 and 30 minutes.
Is This Short-Lived Rise in Ketones Normal?
Is this normal?
I do not think so.
These are the results after an intravenous bolus of 0.3 grams glucose per kilogram bodyweight in first-degree relatives of type 2 diabetic subjects and non-relative controls divided by European or South Asian ancestry:
In the bottom set of data, we see that beta-hydroxybutyrate was generally slightly lower by the 10-minute mark, except in South Asian first-degree relatives of type 2 diabetics, where the median value increased from 0.15 to 0.16. This 0.01 difference is tiny and much smaller than the ranges given in parentheses. Notably the tops of the ranges are slightly lower at the ten-minute mark in all categories.
In men and women with type 1 diabetes, both after a 12-hour fast and after a 36-hour fast, beta-hydroxybutyrate slightly declined by 15 minutes after a 75-gram oral glucose tolerance test:
In a separate study comparing two different types of basal insulin administered 30 minutes prior to a 75-gram glucose tolerance test, at the 15-minute mark beta-hydroxybutyrate declined from 0.16 mmol/L to 0.08 in one group and to 0.10 in the other.
Although this next observation is confounded by the inclusion of protein, acetaminophen, and lactulose in the drink, 15 minutes after prediabetic men and women consumed 50 grams of maltodextrin, their beta-hydroxybutyrate had slightly declined, regardless of whether the drink had no protein (circles), or one of two different types of protein (squares and asterisks):
One study compared a 75-gram glucose tolerance test with and without exogenous ketones in overweight and obese men and women. The very high beta-hydroxybutyrate in the exogenous ketones arm dwarfs the results from the control arm and makes them hard to read. However, squinting closely at the bottom line in this graph suggests to me that, at 15 minutes, glucose either did nothing to, or ever so slightly suppressed, beta-hydroxybutyrate:
On the other hand, there is some indication of a short-lived rise in ketones after pregnant and recently pregnant women were given 0.5 grams per kilogram bodyweight glucose intravenously. This is the beta-hydroxybutyrate response when they were tested at 7-44 weeks postpartum:
The rise is seen at 5 and 10 minutes, mainly in the top line. The top line represents women who had a low insulin response to repeated oral glucose tolerance tests during pregnancy and were “postulated to consist mainly of prediabetic individuals.” This was published in 1975, four years before there were any formal criteria for diagnosing prediabetes.
The next graph is rather confusing upon first glance, but it represents the change from baseline in the beta-hydroxybutyrate level at 20-minute intervals after glucose infusion for postpartum on the left and for each trimester of pregnancy moving to the right:
This is a bit confusing because the non-pregnant test shown on the left happened last. What we can see if we start with the second set of lines and move rightward is that women with poorer metabolic health develop a rise in ketones at the 20-minute mark first, while both groups have a rather exaggerated rise in ketones at the 20-minute mark in the third trimester.
Then, we look at the leftward most graph and we see that the marked rise of 20-minute ketones that took place in the third trimester has calmed down, but not disappeared, 7-44 weeks postpartum.
Note that the 20-minute mark occurred after the major rise in ketones from the previous graph, which was greatest at the 5- and 10-minute marks, so this graph underestimates the short-term rise.
The babies born to these mothers were given an intravenous bolus of 1.5 grams glucose per kilogram bodyweight on their first day of life:
The symbols are the same. The top line is the babies born to the mothers with better metabolic health. They had higher ketones at birth, which rose higher in the time leading up to the test, but the glucose suppressed their ketone levels throughout. The babies born to mothers with poorer metabolic health were born with lower ketone levels, but they rose slightly 5 and 10 minutes after glucose and were not clearly suppressed until the 60-minute mark.
The rises in the mothers are in the range of 0.01-0.05 mmol/L, and the rise in the less healthy infants is about 0.02 mmol/L. These values are much lower than the rise in the 1977 case report of pyruvate carboxylase deficiency.
Nevertheless, they are very easily explainable by my hypothesis!
As I described in High Protein? You Need More Biotin, pregnancy raises the biotin requirement and 30-50% of mothers become spontaneously biotin-deficient during pregnancy as judged by urinary beta-hydroxyisovaleric acid, an inverse marker of biotin status.
Thus, in my view, this short-term rise in ketones in the pregnant mothers reflects progressively increasing biotin requirements that peak in the third trimester, where nearly everyone has sufficiently impaired pyruvate carboxylase activity to show a very mild paradoxical postprandial ketogenesis. This is stronger in the mothers with worse metabolic health because, as I explained in the diabetes section of When High-Dose Biotin Is Truly Needed, a greater impairment in pyruvate carboxylase will lead to a proportionally greater impairment in glucose tolerance.
And it will, of course, cause a greater impairment in insulin secretion (the very criterion by which they were categorized) because insulin does not respond to glucose but rather to potassium inflows into pancreatic beta-cells elicited by ATP made from glucose, as covered in Lesson 23 of my Energy Metabolism class. So, if pyruvate carboxylase is impaired, production of ATP from glucose is impaired, and thus insulin secretion is impaired.
The one other study I found in infants compared infants who were below the 10th percentile of the growth curves to those who were above the 10th percentile. These infants were given 1 gram glucose per kilogram bodyweight intravenously.
The low-weight babies (SGA) had higher beta-hydroxybutyrate at baseline and throughout the test compared to the normal-weight babies (AGA). Both groups had a mild rise in ketones at the 5- and 10-minute marks. In the normal-weight babies the ketones seem clearly suppressed at 20 minutes, while the low-weight babies take till 40 minutes for the ketones to be clearly suppressed.
The rises are very small: 0.03 mmol/L in the normal-weights, and 0.07 mmol/L in the low-weights. This is comparable to the 0.01-0.05 mmol/L rise in the third trimester and postpartum women above.
Interestingly, the normal-weights in this study have similar fasting levels and similar postprandial rises of beta-hydroxybutyrate as the babies born from the less metabolically healthy women in the previous study. This suggests to me that most of the babies in this study were born to mothers with lower metabolic health and greater biotin deficiency. The first study was done in Sweden in 1975, and the second in America in 1969, so the populations are different, but likely the diets were different as well.
All of these rises, collectively between 0.01 and 0.07 mmol/L, are much lower than the rise in the 1977 case report. That baby’s rise was 1.1 mmol/L total ketones. If we assume half of that was acetoacetate, we still have a rise of 0.55 mmol/L beta-hydroxybutyrate, which is 8-55 times greater an increase than found in the pregnancy and infant studies.
So, I propose that the short-lived rise in ketones in the 5-15 minutes after a glucose tolerance test is an indicator of pyruvate carboxylase impairment, and outside of genetic deficiencies it is mainly found in biotin-deficient conditions, including the biotin deficiency that spontaneously occurs during pregnancy. This, of course, is not a natural condition of pregnancy but rather a result of most diets not containing sufficient biotin to properly nourish a pregnancy.
And, if I am more biotin-deficient than most due to my genetics, perhaps I would have such a short-lived postprandial rise in ketones, of greater magnitude than found in pregnancy and infancy, but of lower magnitude than found in a baby with a genetic defect in pyruvate carboxylase that led to her extremely untimely death at 14 months of age.
Did I Have Paradoxical Postprandial Ketogenesis?
The baby from the 1977 case report received a glucose bolus of 0.75 grams per kilogram bodyweight, which for me at the time of my observational period would have been a 52-gram dose of glucose.
I had not discovered any of the papers reviewed above at the time of my observational period, so I was flying blind.
Below I will often refer to my finger prick beta-hydroxybutyrate as “my ketones” for ease of use, but we should keep in mind that this measurement does not include acetoacetate because there is no commercially available home method for easily measuring acetoacetate.
I had loads of dextrose in my cabinets from a previous time where I was eating a zero-fructose, zero-fructan diet for six months to completely destroy a microbiome alteration that had led to fructose malabsorption. However, I felt uneasy about dosing myself with pure dextrose so wanted to get my feet wet using whole foods.
I wound up scrambling together various sources of carbohydrate around in a rather sloppy manner.
The first night I combined 83 grams of cooked and cooled, salted new potatoes and 31 grams of whole wheat sourdough toast, yielding an estimated 33 grams of total carbs.
The second night I combined 10 grams dextrose with 27 grams of carb from the potato, and 13.5 grams of carb from maple syrup, providing approximately 50 grams of total carbs.
In each case about two grams of carbohydrate came from fiber.
Both of these were done after fasting till at least 4:00 PM, with the exception of water and coffee with stevia and cream.
At the 18-minute mark on the first day, and at the 15-minute mark on the second day, my ketones rose before falling at the 30-minute mark:
While the degree of rise, 0.1-0.2 mmol/L is obviously trivial from the perspective of what the ketones would do to my metabolism, it is the fact that they rose rather than fell that is of interest because it is abnormal and because even rises smaller than this, as reviewed above, are potentially a markers of pyruvate carboxylase impairment.
It is interesting that they rose twice as much after 50 grams of carbs (0.2 mmol/L) as after 33 grams of carbs (0.1 mmol/L); however, we cannot read too much into that given that the entire curve is shifted upward for that day. That is probably explained by the fact that I made a failed attempt to get into zone 2 with 30 minutes of walking or jogging at 4.0 miles per hour on my treadmill.
Seeing this, I was cautious about making a conclusion. What if it had simply taken more than 15 minutes for the glucose to begin suppressing my ketones, and the rise was simply what would otherwise have occurred if I kept fasting?
This seems rather unlikely once we look at my ketones across the entire day:
On the second day, the 30 minutes on the treadmill was done close to the 4.5 hour mark, after my ketones had been stable at 0.3 and before measuring them around the 8.5-hour mark when they had shot up to 1.1. Unfortunately, I did not take measurements between those two points.
However, in both cases the slope of increase inflects upward at the point of the carb dose, revealing a faster increase than would be expected from fasting alone. Still, that difference is stronger on the second day where the lack of data in the hours preceding could be distorting the nature of the trend.
Had I seen the data from the 1977 case report at this time, I would have looked at my ketones every 5 minutes for the first 15 minutes. Unfortunately, I had not. Thus, both by not capturing the earliest ketone data and by only measuring beta-hydroxybutyrate, I may have been underestimating the effect in me compared to the one seen in the case report.
In any case, I would need to verify this effect in a randomized controlled trial where I could directly compare the 15-minute rise in ketones after carbs to the 15-minute rise in ketones after continued fasting.
Protein-Mitigated Glucose Intolerance?
My glucose response to the first carb bolus was a big nothing-burger: a rise to 139 mg/dL at 60 minutes and then a decline to baseline by 120 minutes.
My glucose response to the day 2 carb bolus, however, scared the crap out of me.
My glucose rose to 213 mg/dL and seemed to go nowhere for the next hour, though in reality fell to 195 and then to 185, and then remained over 160 at the 2-hour mark, taking 2.5 hours to fall below 140 and possibly as long as 3.5 hours to fully return to baseline.
This was difficult to interpret at the time because the high value scared me and I began trying things to bring the number down.
First I tried walking. There are various studies showing walking helps glycemic responses or reduces the risk of diabetes, and a diabetic named Adam Brown reported that walking (presumably at 2-3 mph) reduced his blood sugar by an average of 1.1 mg/dL per minute. From the 60-minute mark to the 120-minute mark I spent 60 minutes walking at 2 mph and took only 34 mg/dL off my blood sugar, barely more than half of what Brown reported as an average.
I then dosed myself with 20 grams of whey protein twice, and while it seemed in the moment to have a dramatic effect, now that I am graphing my data, when I zoom out, this again seems like a big nothing-burger because the more rapid slope of decline obviously started at the 90-minute mark, before I finished walking and before I took my first dose of whey protein.
This eventually appeared as an even bigger nothing-burger when I realized how rapidly I acclimate to consuming carbs when doing so regularly, and realized that this poor glycemic response was driven by the fact that my baseline diet was relatively low in carbs.
My analysis of my diet at the time suggests my average carbohydrate intake was 100 grams per day, with my intake likely being 40-60 on rest days during the week, 80-100 grams on weightlifting days during the week, and 120-150 grams on days off where I relaxed my diet.
All that said, I outlined in High Protein? You Need More Biotin why I believe biotin deficiency, by lowering pyruvate carboxylase activity, should cause glucose intolerance that can be mitigated or even abolished by consuming protein.
On the other hand, this protein effect seems to be a normal response that depends on the ratio of protein to glucose. For example:
In healthy young men, preloading 50 grams of whey protein 30 minutes before a 75-gram oral glucose tolerance test abolished the blood glucose rise and turned it negative.
In healthy adults, 18 grams of whey protein blunted the glucose response by 56% when mixed into a drink containing 25 grams of glucose.
In healthy, normal-weight, mostly male adults, 40 grams of whey protein blunted the glucose response by 32% when mixed into a drink containing 75 grams of glucose.
On the other hand:
In untrained, recreationally active healthy males who had done an intense lower-body workout the day before, 25 grams of protein had no impact on the glucose response when mixed into a drink containing 75 grams of glucose.
In males with type 2 diabetes, 25-30 grams of whey protein (0.33 grams protein per kilogram bodyweight) with or without prior aerobic exercise had no impact at all on the glucose response when mixed into a drink containing 75 grams of glucose.
While one could point out that all the successful trials were in healthy people, we can expand our view to trials testing carbohydrate sources other than pure glucose in water to see that this is not the likely reason for the discrepancy. For example, 50 grams of whey protein does blunt the glucose response to 50 grams of maltodextrin in prediabetics, and 55 grams of whey protein blunts the glucose response to just under 60 grams of carbohydrate from a mix of potato and glucose in type 2 diabetics when taken 30 minutes beforehand.
Thus, it seems that 25-30 grams of whey protein does nothing to help tolerate 75 grams of glucose, while 40-50 grams of whey protein does help metabolize 75 grams of glucose and only 18 grams of whey protein is needed to help with 25 grams of glucose.
In other words, at least 1 gram of protein is needed for every 2 grams of carbohydrate.
It also seems that preloading the whey protein by 30 minutes is more effective than consuming it at the same time, since the first study did that and actually turned the glucose response negative. That is, the average blood glucose level was lower during the two hours after the glucose load than it was before the glucose load.
As explained in Lesson 23 of my Energy Metabolism class, the main mechanism operating here is most likely that protein is helping to fill up the citric acid cycle in the pancreatic beta-cell. Providing citric acid cycle components is called anaplerosis, from the Greek for “filling up.” When the citric acid cycle is completely full, it overflows, spilling the components out into other pathways. This is called cataplerosis, using the Greek words for “to fill” and and “down, against, or back,” essentially referring to backflow in the sense of overflow. The citric acid cycle components that overflow provide amplification signals that intensify the insulin release triggered by ATP-dependent potassium inflows.
We can then extend this to say that protein would, outside the pancreas, lead to faster glucose metabolism in other tissues, sucking it out of the blood (manifesting as increased “insulin sensitivity”), also by helping to fill up the citric acid cycle and thus ensure that acetyl CoA from glucose can enter it.
However, we could also extend this backward and say that it would have done the same thing on the first-pass through the liver. Thus, more glucose would get metabolized in the liver, leaving less to reach the pancreas. What does reach the pancreas generates more insulin than it would otherwise, and it does so in part by being metabolized to a greater extent, leaving even less glucose to even so much as enter the systemic circulation. Once the glucose is in circulation, there is more insulin to bring it into muscle cells. Once in muscle cells, glucose is again metabolized at a faster rate, appearing as greater “sensitivity” to the insulin.
All mediated by protein overfilling the citric acid cycle.
All of these effects would become much more relevant in a state of biotin deficiency where the ability of glucose to generate oxaloacetate through pyruvate carboxylase is compromised.
Thus, although it is normal for protein to help with glucose tolerance when there is at least 1 gram of protein for every 2 grams of glucose, my hypothesis would be that the effect of protein is stronger in biotin deficiency than with normal biotin status.
Further, for the reasons I outlined in High Protein? You Need More Biotin, I believe that most people do not get enough biotin. So, perhaps the effect of protein is mainly “normal” because it is normal to not get enough biotin, and perhaps this is an even more sensitive index of biotin deficiency than 5-15 minutes of very mild paradoxical postprandial ketogenesis.
Forming a conclusion about whether I personally had glucose intolerance mitigated by protein would await properly constructed randomized controlled trial that I would perform on myself.
As we will eventually see, I have substantially revised this hypothesis as a result of my experiments.
Did Carbs Paradoxically Suppress My Lactate?
On the day 1 carb bolus of 33 grams, my lactate looked remarkably the way the textbook described for pyruvate carboxylase deficiency:
However, on the second day, it just did a little dance and went nowhere:
My suspicion is that there is a tug-of-war going on between glucose increasing the pyruvate load that needs to be metabolized and increasing the oxaloacetate that is needed to metabolize it.
If pyruvate carboxylase is partially impaired, it may require higher glucose concentrations than usual to shove some of it through the reaction, yet too high of a dose maxes out what can be done in that regard and simply piles on the pyruvate.
Moreover, there might be some minimum amount of protein per carbohydrate needed, and my day 1 carbs were all potatoes and whole wheat bread, which have some protein, whereas my day 2 carbs were heavily biased toward simple sugars that provided little to no protein.
Examining this, too, would require properly designed randomized, controlled trials.
And that takes us to October 3rd, when I designed the first of my randomized controlled trials.
My Randomized Controlled Trials
General Methodology
In order to make sure my all my pre-supplementation data, including my randomized controlled trials, were not affected by major dietary changes, I attempted to hold my diet and supplements constant through this period. I will write more about the details of my diet and supplements in a future post.
Inevitably, my workouts would cause variation in these results, but if I had tried to not work out on experiment days, I would have gotten much less exercise during this period, leading to a progressive decline in health across the experiments. So, I worked out as normal, and tried to layer my experimental days across both rest and workout days to capture the natural variation.
In order to ensure that I could use the time of day as a reliable metric of how long I had been fasting, I made sure to end my dinner at the same time every night. Since I typically work till 8:30 PM, my rule was that I would make dinner then, finish all food by 9:30, and only allow myself to freely sip on bone broth after that.
I took all my notes and measurements in Apple Notes. One downside to this is that it was time-consuming to translate data to a spreadsheet afterward, and Notes doesn’t timestamp your entries like a Google Doc would. This means if I forgot to write the time down, I had no way to know what the time of the entry was afterward. A further potentially disastrous downside to this is that the Notes app contains no edit history, which introduces the risk that you could accidentally delete information and have it become irretrievably lost. This is a risk that would never occur when taking notes on paper.
I am inclined to record my data directly into a pre-organized spreadsheet in the future, and to use Google Docs for notes so that that I will have the times of entries even if I forget to record them, and will have a permanent edit history. Paper is wonderful for its permanence but is horrible for the ability to process the data you write down on it. If anyone knows of more privacy-friendly apps than Google Docs and Sheets that timestamp all entries and keep permanent edit histories, please let me know in the comments.
The most rigorous way to approach the number of trials needed in each experiment would have been to do a comprehensive literature search for evidence of the phenomenon I was looking for, derive from that an effect size and degree of variation to expect, and perform a power calculation. However, I was working on other things and was eager to move this forward quickly, so I did not have time to do comprehensive literature reviews. Instead, I simply chose to include at least 3-4 trials in each arm of each experiment.
I used random.org for randomization. Because I was using small sample sizes, I wanted to avoid the possibility that I would get something like 1-1-1-2-2-2 (all control, then all treatment) or 1-2-1-2-1-2 (perfect alternation). So, I would create two possible orders for my treatment and control, and assign each order with a number, 1 or 2. Then I would stipulate a rule that both orders would have to be used at least once if I had three repetitions and at least twice if I had four repetitions. Then I would set random.org to a minimum of 1 and a maximum of 2, and generate random numbers. If the random number generator generated the same order repeatedly, my rule would trigger and fill the last one or two slots with the opposite order. This ensured my order was both genuinely random yet also looked and felt random, in that it would not be completely lopsided or perfectly alternated.
It would have been better to include wash-out periods — spaces of “normal time” — between trials to prevent, for example, epigenetic adaptations to fasting or carb-loading across trials. However, as it stood this took me months, and it could have taken a year or longer if I had done that.
Finally, the randomization and control is meant to tell me what biochemical phenomena are truly operating during this period, and it cannot tell me whether they are caused by, say, biotin deficiency or (V)LCAD deficiency. These conclusions will depend on the less rigorous findings that these phenomena are changed by hypothesis-driven strategies; for example, that they change as a result of biotin supplementation. Even worse than with adding washout periods, randomizing across periods of improved and worsened biotin status would take years. Therefore, randomization was limited to trials of acute phenomena that could be observed within hours, such that sufficient repeated observations could be collected over a maximum of a few months.
Four Hypotheses to Be Tested
I had four hypotheses to test:
I have a 15-minute postprandial rise in ketones after eating carbs.
I have a paradoxical rise of lactate in the fasting state that is paradoxically suppressed by eating.
Any neurological symptoms mainly occur when fasting.
I have glucose intolerance that is abolished by eating protein with carbs.
Trial 1: My Ketone Response to Rice
Before I tested the first hypothesis, I wanted to see if I could induce the same postprandial rise in ketones I seemed to observe after fasting all day first thing in the morning. This would allow me spend less time fasting and be more productive during the day.
However, I failed twice to elicit this rise in the morning. I therefore concluded that I needed to fast till the evening to deplete my aspartate and other biotin-sparing amino acids, and to deplete my ATP levels so that glucose would generate more acetyl CoA through the pyruvate dehydrogenase reaction (Lesson 13).
Thus, my first trial was to test whether I had a 15-minute rise in ketones in response to 30 grams of carbs from white rice consumed after fasting until 4:00 PM that did not occur during 15 minutes of additional fasting.
Notably, it would have made more sense to use 50 grams of carbs, since that is what I used when I experienced my largest 15-minute rise in ketones during the initial observation period. However, I was scared of having my glucose spike over 200, so I used 30 grams instead.
Thus, I randomized myself to three days each of fasting till 4 PM and eating freshly cooked white rice or fasting till 4 PM and not eating anything. In all cases I measured my beta-hydroxybutyrate before at 4 PM and then 15 minutes after eating rice, or 15 minutes after waiting the few minutes it typically took me to eat the rice. I cooked the rice with a pinch of salt, for taste, and to facilitate glucose absorption. I made sure it was freshly cooked for each trial so that it wouldn’t have any resistant starch from cooking and cooling.
My average beta-hydroxybutyrate level fell from 0.8 to 0.7 15 minutes after fasting, but rose from 0.8 to 0.9 15 minutes after eating rice. The average difference between these changes was +0.2 mmol/L.
These results were not statistically significant if I considered them as completely independent of one another, if I used a two-tailed t-test to control for the possibility of ketones either rising or falling, or if I compared the ending ketone values between each group. However, if I examined the change from baseline using a one-tailed paired t-test, the difference was significant at P=0.0371.
This is not the most rigorous way to analyze it, but I did in fact randomize pairs of trials, and there is in fact a progressive epigenetic adaptation to both fasting and carb dosing that could make the third pair look quite differently from the first pair. And indeed exactly that seemed to happen: the first two control trials had a change of zero and the first two carb trials had a change of +0.25, while the third control trial had a change of -0.2 and the third carb trial had a change of -0.1.
The rationale for a one-tailed t-test is that I am trying specifically to rule out the null hypothesis that my ketones didn’t rise, not that they neither rose nor fell. Or, in normal-people language, I am trying to show that rice increased my ketones at 15 minutes, not trying to see whether they went up or down. Of course, the case against a one-tailed test is that the rice could indeed push them down as it did in the third carb trial.
In order to try to get better statistics, I randomized one more pair of trials to be done immediately, and then another pair to be nested inside a later experiment.
I pooled together all trials regardless of randomization scheme that involved a carb dose after fasting till 4:00PM, including the two from my observational period, and the results look like this:
The difference in absolute 15-minute ketone values is not statistically significant, but the changes from baseline are significantly different using an unpaired, two-tailed t-test at P=0.0406.
I consider it justified to use a paired t-test since I randomized pairs of trials and since the pairs are situated at similar points during the inevitable epigenetic adaptations to repeating the trials. Using a paired t-test lowers the P value to 0.0249.
The average change with continued fasting was -0.03 and with the carb load was +0.11, with the difference between them being +0.14 mmol/L.
Overall, this is less rigorous than having done a power calculation from the literature and having properly randomized a sufficient number of pairs from a single randomization event, but it is rigorous enough to convince me that my hypothesis is correct: during this period I had a mild degree of paradoxical postprandial ketogenesis that is abnormal, greater than found in the mothers and babies from the 1969 and 1975 papers, but lesser than found in the 1979 case report of the baby with pyruvate carboxylase deficiency who died a couple of months later.
It is likely underestimated, however, by not being able to measure acetoacetate and by not measuring my ketones at the 5- and 10-minute marks.
On the other hand, it appears to only manifest after fasting for 18 hours. It is hard to say for sure that it is abnormal, because most cases in the literature did not involve an 18-hour fast. Nevertheless, there was one paper in diabetics that showed this did not happen even after a 36-hour fast.
Secondary Endpoint: Did Rice Suppress My Lactate?
This trial also allowed me to make a randomized comparison between 30 grams of carbs from white rice and continued fasting to look at the 2-hour impact on my lactate.
The results are not as impressive as the day 1 carb bolus from my observational period, but they are interesting:
We can see a trend toward a decrease with rice and an increase with continued fasting. However, the spread between the baseline values in each group of trials makes a change-from-baseline analysis vulnerable to regression to the mean, and yet simultaneously makes it harder to see a difference between the ending values that may represent real a physiological phenomenon.
Since this is extremely underpowered for the purpose, I decided to do a single t-test on the 90-minute mark. I would have used the 120-minute mark but one of my control trials did not have a 120-minute measurement. The difference is not significant, with P=0.1447. The P value can be reduced to 0.0742 by using a paired t-test, which may help control for the epigenetic adaptations that occurred during repeated fasting and carb-dosing.
While these results are not very convincing, it is quite interesting that the lactate goes down instead of up. There is some degree of “paradox” in that it simply does not go up.
One thing I think is relevant: 30 grams of carbs is only 120 Calories, and by 4:00-6:00 PM I am already some 800-1200 Calories behind in food intake.
So it may be that there is a suppressive effect of carbs, but it is rather weak when limited to 30 grams. Yet, higher doses on their own may max out the suppressive effect while piling on the pyruvate load. It then may be the mixed, protein-inclusive meal that truly has the power. We will find evidence of this in my next trial.
Trial 2: My Neurological Response to Fasting
At first I was noting down the neurological symptoms I would get on the fasting-till-4:00 PM days as a means of investigating the neurological hypothesis. However, I soon realized that this approach was likely leading to a tremendous amount of bias.
The reason was that I often had to decide whether something was worth writing down.
Was forgetting the glucose measurement by the time I looked at the ketone and lactate measurements and tried to write all three down at the same time an example of short-term memory loss?
Was the ringing in my ear that lasted one second worth recording?
I realized that if I had to make decisions like this, and if I believed that my neurological symptoms were induced by fasting, then I was likely to make decisions in these gray areas with a bias toward confirming my hypothesis.
I decided that the best solution to this was to come up with a pre-specified scoring system for all the symptoms I would consider, and then to mercilessly track everything no matter how trivial it could have seemed on the specific days included in my experiment. Within this framework, I would randomize myself to three days of fasting till 4:00 PM and three days of eating regularly.
My pre-specified symptom score was as follows, with a number of points allotted to each symptom based on how intrinsically concerning I considered that symptom:
Tingling in hands upon sitting on hard surface, 5
Tingling in feet upon sitting on hard surface, 4
Acute tinnitus, 4
Feeling of something crawling on face, or feeling after touching face does not go away, 3
Short-term memory loss, 3
Twitching, 2
Brain sluggishness 1
Briefly, the reason for the intrinsic concern scoring is as follows:
The first two were what characterized the event last summer that motivated me to do this in the first place. Tingling in the feet in response to sitting was more logical and less obviously systemic than tingling in the hands, so I rated it of lower concern.
The acute tinnitus refers to ringing in my ears that rarely lasts more than a few seconds. This had almost completely disappeared at the beginning of last year when I stopped using airpods and otherwise stopped putting sound inside my ears in any form. However, it still happened sometimes and this residual tinnitus concerned me precisely because it was what did not disappear after I stopped putting sound in my ears.
The feeling of something crawling on the face is residual from my old experience of mitochondrial damage from terbinafine. That it isn’t 100% gone yet is 99% gone and has done nothing but slowly decrease over time makes it of moderate concern.
Short-term memory loss is of moderate concern because a) it is never that bad, but b) if it happens more frequently over time it creates a worry that my brain health is declining.
Twitching is of little concern because I consider myself a master of preventing and treating it.
Brain sluggishness is simply to be expected when fasting, given all of my prior experience.
During the experiment, I would rate each symptom when it occurred by a separate score based on how severe it was compared to my usual experience, with a rating of 1-5, and 3 being the default if nothing stuck out to me as being more or less severe than usual. The severity score would be multiplied by the intrinsic concern score and then all the items would be added together for each relevant period.
For example, if my ear started ringing for a few seconds, this would be typical (3) and get an intrinsic concern score of 4, yielding 12 points toward the score for that day.
To test for the tingling upon sitting, I would make sure to spend an hour straight sitting in my office chair around 2 PM each day.
These experiments were done across the middle of November.
The score was indeed higher when fasting, but not as much as I would have thought. The mean score was 19.3 on fasting days and 16.7 on regular days, only 15% greater with fasting. However, the regular-day score is biased by day 2, where I was catching a cold. That one day had a score of 26, while the other two regular days had an average score of 12. If I remove that day, fasting produced 60% greater symptoms.
While the score on fasting days was higher, these results were not even close to statistically significant: P=0.7812 without removing the day I got a cold, and P=0.5125 with removing that day.
This failed to support my hypothesis that fasting was provoking my neurological problems.
This negative result is probably due in large part to having developed a scoring system ad-hoc without spending any time honing it for reliability and consistency, thus making it extremely variable.
There are a few other notable observations from this experience:
The tingling in my hands and feet in response to sitting did not occur at all.
The brain sluggishness very reliably and only occurred during fasting.
I had a number of symptoms occur during fasting that I had not pre-specified: on one day, I got a headache during fasting that went away when I ate; on another fasting day I had a moment where swallowing felt difficult; I felt itchy in the evening on one fasting and one regular day, but it was much worse on the fasting day.
Was Body Fat Curing the Tingling and Numbness?
The most provocative point that emerged from this experiment was that the tingling was going away.
It was particularly remarkable that I tried sitting for an hour on my office chair at the same time every day to provoke the tingling in my hands and feet, yet I didn’t experience it once.
By contrast, in my October experiments where I fasted until 4:00 PM before a carb load, I noted experiencing this tingling four times while fasting.
On my two observation days toward the end of September, I had found it repeatable that I could provoke the tingling by sitting when fasted, but not when I had eaten.
This seems to line up temporally with, and be related to, another problem I had noticed last year: I would wake up with one or both of my hands feeling slightly numb. I wrote in my notes on October 13 that this problem seemed to be getting worse. On November 20, I wrote in my notes that it seemed this hadn’t happened for a while.
What changed?
One thing that changed is my bodyweight increased. During my September observation period, I weighed 153.8-155.3 pounds. During my October experiments, I weighed 152.2-154 pounds. During my November experiments, I weighed 155.5-157 pounds.
Thus, in November I weighed a couple of extra pounds.
Another thing that is notable is that I had performed 10 experiments fasting till 4 PM between the end of September and the end of October. Was I acclimating to fasting?
I am inclined to choose the bodyweight hypothesis:
On October 13, when I noted it had been getting worse, I had already done 8 days of fasting till 4 PM, but my weight had dropped to 153.2 pounds.
On November 20, when I remarked that it had not occurred in a while, I had only fasted once in the previous 19 days and my weight had increased to 157 pounds.
Thus, my suspicion is that having a higher fat mass mitigates some aspects of the underlying problem with energy metabolism by leptin signaling convincing the brain that it is safe to raise the metabolic rate higher, and that my bodyweight fluctuating between 153 and 159 pounds actually straddles with impressive precision the tipping point between vulnerability and non-vulnerability to tingling and numbness.
In this vein, it is worth noting that as a teenager and in my early twenties I had a seemingly related but much worse problem: I would often wake up in the middle of the night in a panic with one arm completely paralyzed. The only way to revive it would be to shake it with the other arm. On very rare occasions, I had woken up with both arms paralyzed. This was completely terrifying and the only way out of it was to stand up and shake my torso back and forth, flailing my floppy arms around until they woke up.
This was worst when I was a vegan, and had disappeared when I started working out, packing on muscle in the post-WAPF era. I had been wondering whether it was better because of nutrition, especially B vitamins, or because I was emaciated as a vegan and was jacked in those days. I asked my college A&P teacher about it and he hypothesized that I needed a certain amount of muscle or fat to physically cushion the nerves.
I do not want at all to discount that hypothesis, especially since the physical pressure of sitting was eliciting tingling last year. However, I do now see energy metabolism as king, so it is my strong suspicion that a couple of extra pounds of body fat help compensate for an underlying problem in the efficiency of making ATP from food.
So, despite the failure of my second randomized trial to confirm my hypothesis, my current belief is that fasting makes me more vulnerable to neurological problems, but extra body fat makes me less vulnerable.
My Glucose, Ketone, and Lactate Responses to Fasting Till 4:00 PM Vs Eating Regularly
This is my glucose on regular days:
My breakfast was a salad of seasonal fresh and fermented vegetables, 3 boiled eggs, salt, pepper, and olive oil, with a glass of raw milk.
It tended to push my glucose into the 70s at the one-hour mark, perhaps because it had the highest ratio of protein to carbohydrate. You could call this “reactive hypoglycemia,” yet I always felt great and much better than I did when fasting.
My lunch was four Paleovalley beef sticks, 100 grams of homemade gelatin made from Great Lakes culinary gelatin and a rotation of different organic fruit juices, and a glass of raw milk.
This seemed to counteract the rise in glucose that was otherwise happening in the afternoon.
My dinner was a plate of one-third meat, one-third starchy seasonal vegetables, and one-third leafy seasonal vegetables, with a glass of raw milk, a cup of warm bone broth, and extra calorie fillers if I felt I needed them such as sourdough whole wheat toast or popcorn provided from my farm CSA.
This was was my highest-calorie meal and highest-carbohydrate meal and it elevated my glucose the most.
My glucose on fasting days was quite boring:
However, the two points with large error bars at the fourth and sixth measurements reflect two points where my glucose had gone down into the 70s, once before eating anything, and the other after having eaten.
I felt better after eating and worse while fasting, and my blood sugar was completely irrelevant to how I felt. My glucose going into the 70s after eating had nothing to do with my glucose going into the 70s during extended fasting in terms of how I felt.
This is one of my central central insights from this experience:
Everything I had considered “feeling hypoglycemic” prior to doing these experiments turned out to have nothing to do with hypoglycemia.
There were two ways to push my glucose to 70 mg/dL: I could fast my way there, or I could eat my way there. When I fasted my way there, my brain felt deprived and my body felt edgy. When I ate my way there, my brain felt fueled and I felt calm.
That is, my glucose level was irrelevant and it was all about how I got there. Eating gave me ATP. Fasting made me run low in it. The glucose concentration in my blood was incidental.
I am not saying that if my glucose went down to 50 mg/dL I wouldn’t have felt terrible. I am simply saying that in the range of glucose concentrations I typically experience, my blood glucose is not a useful indicator of anything.
This is my ketones on regular days:
It is interesting that they fall before my breakfast, which would correspond to the time I spend drinking coffee outside in the sun and doing morning exercises. They seem to rise throughout the day, despite repeatedly eating, which is backwards and consistent with pyruvate carboxylase deficiency.
Strangely, my breakfast and lunch seem to do almost nothing to suppress them.
It is also interesting that my ketones are appreciable on a diet that averages 100 grams of carbs per day, which strikes me as mildly abnormal and consistent with mild pyruvate carboxylase deficiency.
My ketones rose during the fasting state and were suppressed by eating.
This is totally normal, yet not quite what they seem to do on regular days.
This is my lactate on regular days:
It seems to drift upward throughout the day, which I think is abnormal based on the literature, and consistent with mild pyruvate carboxylase deficiency.
My impression is that breakfast mildly suppressed my lactate after the 30-minute mark because it has the highest protein to carbohydrate ratio, similar to how it suppressed my glucose.
Nested Observation: The Paradoxical Rise and Fall of Lactate
My lactate on the fasting days is remarkable, and is very consistent with the textbook claim that in pyruvate carboxylase deficiency lactate rises in the fasting state and is suppressed by carbohydrate:
These were mixed meals that were the same as on regular days, only in the order of lunch, breakfast, dinner every two hours after the fasting period.
My lactate simply rises all day in the fasting state and then is markedly suppressed by my meals, which is totally backwards.
While the comparisons of what happens between the regular and fasting days are randomized, the comparison between what happens before and after I eat on the fasting days is not randomized because I never randomized myself to continue fasting throughout the rest of the night versus eat.
Therefore, this is an observational finding nested within my randomized controlled trial. Yet it is too remarkable to ignore.
A simple unpaired, two-tailed t-test of the peak fasting lactate and the end-of-the-night lactate is not statistically significant but is somewhat close at P=0.097.
This is completely backwards, and apart from not being randomized is otherwise the strongest piece of evidence I have for impaired pyruvate carboxylase activity.
Trial 3: Protein and Glucose Tolerance
My protein and glucose experiment seemed like it should have been fairly straightforward: randomize myself to a load of glucose with and without protein.
However, one problem was selecting the dose of glucose to use.
My glucose shooting over 200 after 50 grams of carbs in September had worried me.
Was this my reliable response to 50 grams of any carbs?
Or was it 10 grams of dextrose powder that shot my glucose to 213, while the maple syrup digested next and kept it high, and the cooked and cooled potatoes digested last and kept it elevated for hours?
I decided to use pure dextrose powder, but only after gradually testing my response to incrementally higher doses starting with 5 grams.
I wanted to find a dose that would not spike my glucose over 200, but would spike it to between 160 and 180 and leave it higher than 140 for an hour, so I had something real to work with when looking for the effect of protein.
I arrived at 30 grams on a morning where I had had several drinks the night before and had gotten only four hours sleep. This spiked my glucose to 194 by 30 minutes. Then it fell to 132 by 60 minutes and to 108 by 75 minutes. I didn’t want my glucose going any higher than 194, so I selected this dose.
Part of me felt I should repeat this after a night of good sleep. But the stronger part of me said that it was already December 2, and I needed to finish these experiments once and for all before New Year’s.
So I randomized myself to 3 trials of 30 grams of glucose with and without 40 grams of whey protein.
During all glucose tolerance tests, I sat on the couch and tried to avoid walking other than to get up and go to my finger prick station at the appointed times. I either played video games or did work on my phone or laptop. This was to help minimize the influence of activity on my blood glucose.
If I noticed my weight increasing during this period, I would cut back on added oils to even out the calories while having a minimal impact on overall nutrition.
The area under the curve for the glucose response represents the total exposure to glucose over a given period of time, and it is the best way to summarize the glucose curves. I calculated it over the course of one hour, which makes it equivalent to the average blood glucose across that hour. I used the trapezoidal method for the calculation.
In my graphs, I begin the y axis at 85 because it is a typical value for my waking glucose, and end it at 140, which I consider the upper bound of healthy postprandial levels, or at some higher number if needed to capture the data.
Results of the First Glucose-Protein Trial
The glucose response without protein was only 7% greater than with protein, and it was not statistically significant (P=0.2934). However, as you can see in this graph, where the horizontal lines represent the group means and the dots represent the individual trials, this was due to massive variation in the control arm:
The reason for this variation becomes much clearer if we look at the results according to the order in which I performed the trials in each arm:
The protein trials had a relatively constant glucose AUC near 110 mg*hr/dL. The control trials started at 130, then fell approximately 10 points with each successive trial until the third matched the protein trials.
Thus, it would appear that the glucose AUC I am “supposed to” have after 30 grams of carbs is approximately 110. With protein, my body was able to achieve that AUC without adaptation. Without protein, my body had to use epigenetic changes to produce that response.
If I add in the pre-trial carb escalation test where my glucose spiked to a peak of 194 after 30 grams as “trial 0” it almost fits the adaptation line:
The AUC was 156, whereas I would have back-predicted it to be 140 if I were looking at the slope of adaptation during the trials alone. Thus, likely almost two-thirds of the difference is simply due to the lack of adaptation, and only a third to having drinks and getting four hours of sleep the night before.
My average carbs per day was about 100 grams, so adding a 30-gram glucose tolerance test increases by carb intake by about 30%, but also provides carbs in a much more rapidly absorbable fashion than I would usually get them. Thus, the adaptation this should require is significant.
The Adaptation to Repeated Glucose Tolerance Tests
This then led me to try to find the glucose load to which I could not easily adapt.
First I jumped from 30 grams to 40 grams. This is what three trials with 40 grams looked like, spaced three days apart, on December 20, 23, and 26:
This shows much more rapid metabolism of glucose with each successive trial. The time to peak glucose decreases from 45 minutes to 30 minutes to 15 minutes. The peak glucose decreases from 186 to 174 to 148. In the first trial, the glucose did not return to baseline even by 90 minutes. In the second two trials it had declined into the 70s by 75 minutes.
Again, I felt much better having gotten glucose into my system than not, and it made no difference that my glucose dropped to 70. I felt fed, because I was. (Partly; I would feel better with a normal meal.)
Since the glucose did not return to baseline within one hour in these trials, I had to calculate the AUC across the full span, so the number is somewhat larger than the average glucose level across the curve. The AUC declined from 204 to 164 to 162.
I was interrupted for 8 days as a result of holiday festivities and family events, and then returned to this on January 4. I assumed I would have lost some of my adaptation, so I repeated the observation all over again with three fresh trials. These trials were done across 4 days, on January 4, 6, and 7:
I was not able to let the first trial return to baseline as a result of a scheduled podcast recording. The second returned to baseline by 75 minutes, and the third by 60 minutes. The peak glucose occurred at 30 minutes in all trials, but the third trial had almost reached peak glucose by 15 minutes. The peak glucose declined from 195 to 162 to 137.
The AUC declined from 196 to 166 to 120.
I only measured the third trial till the 60-minute mark because it had returned to baseline. However, if I impute my waking glucose level of 86 to the 75-minute mark in the third trial, it would raise the AUC to 141.
The average glucose level across the three trials went from 157 to 133 to 114.
When I look at these trials, my interpretation is that the “end game” of the adaptation is to defend 140 mg/dL as peak glucose, as this represents the approximate inflection point where glucose will spill over into the polyol pathway, as I described in the Erythritol and Blood Clotting article.
A secondary “end game” to the adaptation seems to be to bring the average glucose into the 110-120 mg/dL range.
It is important to realize that the first set had 2 days of rest between each trial.
“Rest” in this section means a rest from doing glucose tolerance testing.
The second set had 1 day of rest between the first two trials and no days of rest before the third trial. Thus, there was 4 times more rest between the first set as between the second set, and there were 3 more total days of rest between those trials.
This might explain the superior level of adaptation in the third trial of the second set compared to the third trial of the first.
My first tentative conclusion is that it takes me three trials spaced close together to reach maximal adaptation, which suggests an adaptation rate of 3.3 grams per day.
It seems to me that at the rate of improvement within the first set, I would have required one or two more trials to reach the “end game.” If three extra days of rest created the need for one or two more trials, this suggests that adaptations are lost somewhere between 50% more slowly and three times more slowly than they are gained.
However, I cannot rule out that having done the first set of trials potentiated the better adaptations in the second set. If there is any truth to that, then the rate of adaptation may be somewhat slower, perhaps as low as 2-2.5 grams per day, while the rate at which adaptations are lost would also be slower, perhaps taking 3-4 days of rest to lose each one day of adaptation. My next few trials lend support to this.
The next day I tried a 45-gram dose:
The peak glucose was between that of the second and third 40-gram trials, and the average glucose was essentially identical to the third 40-gram trial. This suggested to me that I was almost fully adapted to 40 grams in one go.
I then did two 50-gram trials, the next day (January 9) and four days later (January 13):
The fact that I had three days rest between these two trials yet still got the peak glucose down almost to 140 and the average glucose down to 120 supported a mixed model where the previous history of trials over the course of weeks was potentiating the ability to adapt to new doses.
In this case, it took 3 trials to be able to go from 40 grams to 50 grams and reach the “end game,” even though one of those trials was only 45 grams and there were three days of rest between them.
However, this rate may have been strongly influenced by having done 6 trials of 40 grams before increasing.
Another way to look at this more cumulatively would be that it took me 9 total trials of doses between 40-50 grams to fully adapt to the move from 30 to 50 grams while having 8 total days of rest between them.
This cumulative model would suggest that I can adapt to increasing bolus doses of glucose at a rate of 2.2 grams per day if the doses are spaced on average every other day.
My experience between the first and second sets of three trials with 40 grams suggests that at least some of that adaptation is lost with 2-3 off-days for every adaptation day.
The Second and Final Protein-Glucose Trial
With this in mind, I decided to trash my idea of finding a dose of glucose I could not adapt to, and decided instead to ride the wave of adaptation within my final experimental trial.
I would randomize pairs of increasing doses of glucose. If it took me two days to adapt to five grams, then each dose would get a glucose-alone and a glucose-with-protein pair, but in random order, and I would be operating slightly behind the adaptation curve the whole time.
Then, I would for these pre-planned reasons use a paired t-test to compare the two conditions.
So, I randomized the orders of four pairs across the doses of 55, 60, 65, and 70 grams of glucose. I stipulated that each order had to be used twice. However, life intervened and created a five-day gap between the third and fourth pairs. I therefore made the executive decision to repeat the 65-gram dose for that pair, figuring I would have lost some of the adaptation. So what I actually did was one pair at each dose of 55 and 60, and two pairs at 65. These were done between January 14 and January 27.
A first glance at the glucose curves suggests the protein helped a bit but not tremendously:
Most trials obtained a return to baseline within 90 minutes, but three took longer, which is why there are no error bars at 105 or 120 minutes. One of the control trials did not return to baseline within 120 minutes at which point I stopped taking measurements. The reason for the dip and rise in that trial is likely that I had to run some errands at the end and was walking prior to the second-to-last measurement.
However, I cannot find anything statistically significant.
It is interesting that in a championship game where the aim is to defend the 140 mg/dL line, protein on average wins and control on average loses.
Yet, t-tests of the peak glucose or of three different versions of the AUC (including a one-hour cutoff, or imputing missing values to trials ending earlier to use 90-minute or 120-minute cutoffs) are not significant.
Did Glucose With or Without Protein Suppress My Lactate in the Morning?
In contrast to all of my experiments that were done after fasting till 4:00 PM, my glucose tolerance tests were done in the morning and did not show any trend toward carbohydrate or protein suppressing lactate.
In the first trial, lactate went up, especially after one hour, and protein, if anything, seemed to make it worse:
During the later trials with larger doses of glucose, it looks a little different:
There is some indication that protein blunts the lactate response to glucose at the 30-minute mark, but it is hard to see this as more than cherry-picking given the absence of this trend in the first trial. Otherwise, it looks like protein makes no difference.
However, these were not done after fasting until 4:00 PM, which seems to be the unique situation in which all of my evidence for pyruvate carboxylase deficiency emerges:
This is when 30 grams of carbohydrate from rice causes 15 minutes of mild paradoxical ketogenesis.
This is where my lactate paradoxically rises.
This is when 30 grams of carbohydrate from rice seems to have a weak trend toward a possible suppression of lactate.
This is when mixed meals seem to clearly suppress my lactate, though this observation is not randomized.
Whether the protein-glucose interaction would look different after fasting till 4:00 PM unfortunately cannot be discerned from any of my data.
Waking Values of Glucose, Ketones, and Lactate During Adaptation to Repetitive Glucose Tolerance Tests
The progressive adaptation to glucose tolerance testing altered my waking values of glucose, ketones, and lactate.
My average morning lactate was 0.6 in November and had doubled to 1.2 in January.
If my pre-glucose and post-glucose values are pooled, they increased 64% from my pre-glucose average of 0.692 to my post-glucose average of 1.13, and this was highly statistically significant at P<0.0001 in an unpaired, two-tailed t-test:
From the literature — all exercise science studies — my lactate response appears abnormal. Fasting lactate does not change after shifts to high-carb or low-carb diets lasting two days, four days, 21 days, or 42 days. My waking lactate rose to the higher level within the first days of using higher-dose glucose, so well within the adaptation period allowed for in all of these studies.
I believe this reflects poor clearance of lactate due to an impaired malate-aspartate shuttle as a result of pyruvate carboxylase impairment, ultimately owing to poor biotin status.
The exact opposite happened to my waking glucose. I started the y axis at 70 mg/dL to highlight the differences, since normal waking glucose levels are so far away from zero:
If my pre-glucose and post-glucose values are pooled, they decreased 6% from my pre-glucose average of 93.1 to my post-glucose average of 87.8, and this was highly statistically significant at P=0.0009 in an unpaired, two-tailed t-test:
This seems like a healthy response: eat more glucose, get better at using glucose, use more glucose.
I believe the response in the general population is heterogeneous. Since I am not diabetic or overweight, the relevant studies to determine if this is normal would be those done in normal-weight, non-diabetic individuals.
I found two:
In a randomized trial of 6 weeks of high- or low-carb diets in distance runners, fasting glucose was 5.4 mg/dL higher at the end of the trial on the high-carb diet. However, this was not statistically significant, and the standard deviation was 8.6 mg/dL, suggesting the spread could be 17.2 mg/dL in 95% of a large population.
In a randomized trial of 4 weeks of such diets in healthy young, moderately trained males the high-carb diet led to 13.5 mg/dL higher fasting glucose, but again the standard deviation was very high, 29.7 mg/dL, suggesting the spread could be 59.4 mg/dL in 95% of a large population.
Thus, my response is not average, but I believe many people in the minority respond similarly to me.
I suspect this reflects that I have a very healthy insulin response, and very healthy regulation of glucose transporters, hexokinase enzymes, and glycolytic enzymes, which all lead me to be very good at keeping my glucose inside cells.
However, the pyruvate carboxylase step is blocked, so the ultimate fate of glucose is disproportionately lactate rather than to be fully burned for energy.
My ketones, however, surprise me a bit.
They began decreasing around November 6. This was after my fasting and rice load experiments of October, and my randomized controlled trial of fasting versus regular diet in November, where half of the fasting days involved a rice load in the evening. Perhaps the waking ketones were dropping because my fasting days pushed all my food into the evening, or because the ketones were more sensitive to the rice loads than the glucose and lactate, or some combination thereof.
Adverse Effects of the Glucose Tolerance Tests
When the dose of glucose reached 40 grams, I noticed a pimple underneath my beard on the left side of my face. I have never been vulnerable to acne, so I think this is consistent with the insulin hypothesis of acne.
However, I cannot rule out the pantothenic acid hypothesis of acne. If pyruvate carboxylase is deficient, high doses of glucose could lead to acetyl CoA accumulating, and thus to CoA sequestration, temporarily raising the need for pantothenic acid or vitamin B5.
Once the dose of glucose reached 65 grams, I had two days of loose stool that gradually normalized over the course of several days. I consider this very minor. I wonder if I should have included salt with the glucose tolerance tests like I did with the rice to facilitate glucose absorption, and I wonder if this would have impacted by glycemic responses.
While I would have regarded the increased vulnerability to acne as a transient and minor effect as well, the last event of this period has changed my mind. Between the third and fourth pairs of my last glucose-protein experiment, I shaved my beard and then let it regrow. While my beard was regrowing, I developed a second pimple on the right side of my face that became infected and turned into a large abscess. This went away in a few days with topical clindamycin, but it left minor darkening of the skin and an extremely subtle bit of knobby tissue where it started a month later.
As I described in Getting to the Bottom of My Health: Biotin and (V)LCAD, unbeknownst to me at the time my biotin status had been in free-fall throughout this period and had bottommed out at the beginning of February when I started biotin supplementation.
I believe the infected pimple was a perfect storm of the following:
Either hyperinsulinemia or CoA sequestration from the glucose tolerance tests making me more vulnerable to acne.
My biotin status reaching a nadir and making me more vulnerable to infection.
Shaving my face making cuts in the area.
My hair regrowing, giving opportunity for the skin to be disrupted in the area where the pimple arose.
So, while I think under other circumstances I could have gotten away with the repeated glucose tolerance tests without such an adverse event, I would not recommend anyone do this at home and I will likely never do it again. If I ever do a similar experiment I will be much more conservative about the glucose dosing and will probably limit my experiment to few repetitions and to the use of whole foods that have relevance to my actual diet.
Conclusions From the Glucose Testing
My glucose testing clearly fails to support my hypothesis that biotin deficiency would cause glucose intolerance mitigated by protein. While protein might be having a small benefit for my glucose tolerance, it clearly is less than the benefit reported in the literature for healthy adults.
However, if I try to integrate this with my review of the existing literature, the major issue seems to be whether the dose of protein is sufficient to match the dose of glucose. In the literature, it seems at least one gram of glucose is needed for every 2 grams of carbohydrate.
Perhaps in the biotin-deficient state, the big difference would be that more protein than this is needed. That might explain why protein seemed effective in minimizing my glucose response to 30 grams of glucose right out of the gate, but was much less effective at neutralizing my response to 55-65 grams of glucose.
The reason more protein would be needed is because in the person with normal pyruvate carboxylase, they get plenty of oxaloacetate from glucose, and all the protein is extra, leading to cataplerotic outflow of citric acid cycle components that amplifies the insulin signal. In the person with impaired pyruvate carboxylase, that protein first has to simply make up for the deficit in oxaloacetate before it can be put to use as an amplifcation signal.
This, to me, remains a wide open question.
The main thing I learned from my experiments was instead the rules of adaptation:
I can adapt to increasing bolus doses of glucose at a rate of 2.2 grams per day if the doses are spaced on average every other day.
At least some of that adaptation is lost with 2-3 off-days for every day of adaptation.
The Final Experiment: Have a Beer With Masterjohn
On Friday, February 3, 2023, as documented on live video in “Have a Beer With Masterjohn,” I sought to replicate my August 10, 2022 experience that initially provoked me down this field of investigation.
On August 10, I was under dramatic work stress until I finished my project at 4:00 PM. Up to then, I had only had coffee. I then ate my typical breakfast, a salad of seasonal veggies, boiled eggs, and raw milk. I then went to meet up with friends who I thought were eating, but instead got wrapped up in a lively conversation over a beer. We were sitting on a hard bench. My feet and hands started tingling. Eating made the tingling in my hands go away, but the tingling in my feet did not go away until I stood up for a while so I was no longer sitting on a hard surface.
On February 3, I could not replicate the work stress. Instead, I went snowboarding while fasting to endure some physical stress, as well as some mild height anxiety I get on the chairlift. I ate the same meal at 4:00 PM, and then I drank about 1.5 beers while having a lively conversation on live video at 7:00 PM. The whole time I sat on my stiffest chair.
I failed to generate more than the tiniest amount of tingling.
However, there is one metabolic result that sticks out.
Here is glucose:
Here is cortisol:
These were within the normal ranges for their respective times of day, according to the DUTCH report.
.The ketones look quite boring:
And then… drumroll…
There’s the lactate:
Holy moly that’s some lactate!
I was a drinking an IPA, which is not sour, so should not have more than trace lactate. The lactate meter (NovaBiomedical Lactate Plus) does not clearly state its isomeric specificity, so it is not clear if it would pick up bacterial lactate.
I tested my beer with the lactate meter (same beer as I used on February 3) and it clocked in at 0.6 mmol/L. The average human has almost 5 liters of blood, 3 liters of which is plasma. 18 ounces of beer is 0.53 liters, which means there were 0.32 millimoles of “lactate” in the beer I drank. If 100% of that entered my bloodstream at once, and was not taken up by any cells or metabolized in any way — which is completely implausible — it would be distributed through 3 liters of plasma and would raise my plasma “lactate” by 0.11 mmol/L.
The beer rose my lactate 26.3 times more than this.
Therefore, this is definitely not an effect of any “lactate” in the beer and is almost certainly an an effect of the alcohol.
Why Alcohol Raises Lactate
Ethanol is metabolized primarily in the cytosol of the liver, where alcohol dehydrogenase uses NAD+ to oxidize it to acetaldehyde, loading electrons onto NAD+, forming NADH.
Acetaldehyde then moves into the mitochondrion, and a second enzyme, aldehyde dehydrogenase, does the same thing, generating NADH and acetate.
Acetate is then joined to CoA to form acetyl CoA and has the same fate as acetyl CoA from any other source.
Thus, each molecule of ethanol converts one cytosolic NAD+ to NADH and one mitochondrial NAD+ to NADH.
The cytosolic NADH can either transfer to the mitochondria using the malate-aspartate shuttle, or reduce pyruvate to lactate.
As long as ethanol is in the system, it is serving as a continuous flow of electrons to flip cytosolic NAD+ to NADH. This not only generates lactate, but it also prevents the liver from using lactate coming from other tissues, since this lactate would have to be oxidized using NAD+ to be burned for energy.
It has been known for more than a half century that ethanol causes blood lactate to go up, by increasing lactate production and especially by decreasing its utilization.
Is a Rise to of Lactate to 4 mmol/L After 1.5 Beers Normal?
However, should 1.5 bottles of IPA shoot it up to 4 mmol/L?
No.
18 ounces of an 8.7% beer should have 43.8 grams of ethanol.
This, in the open squares, is the rise in lactate that occurred in healthy male and female volunteers aged 19-35 in the two hours after drinking 19.6 grams of ethanol from bourbon, blended whiskey, or Scotch:
It rises from around 0.5-0.75 to 1.5.
In recreationally active men, 12.1 grams of ethanol from a 40% vodka delivered in two doses spaced one hour apart barely moved lactate at all.
In white men and women in their 20s, 0.5 grams of ethanol per kilogram bodyweight from a mixture of ethanol and lingonberry juice consumed over 15 minutes increased lactate from 0.52 to 0.83 1.5 hours after intake. Using my bodyweight from February 3, this would be 35.8 grams of ethanol, very close to the 43.8 grams of ethanol I estimate that I had consumed to bring my lactate to almost five times what this study achieved, but it was consumed more than 8 times faster.
In Japanese men and women, 24 grams of ethanol from a 5% beer consumed over 30 minutes in some and up to 2 hours in others drove lactate as high as 2.2 mmol/L, though the starting values for lactate were rather high, in the range of 1.5 to 1.75.
The following graph shows the lactate levels of type 2 diabetics after rest or exercise, with or without 0.4 grams of ethanol per kilogram bodyweight, drunk within 15 minutes. The filled black circles represent ethanol alone, and the white open circles represent rest alone.
This is the equivalent of me consuming a total of 28.7 grams of ethanol on February 3, but doing it in 15 minutes instead of 2.5 hours. I estimate that I drank 52% more than this, yet the rate at which they drank their ethanol was 6.5 times faster than mine. Even though they are diabetic, which itself predisposes to increased lactate production, their lactate does not reach higher than 2.1 mmol/L.
The following graph is from what appears to be the king of all relevant studies.
It shows the effect of ethanol with or without glucose or fructose in males aged 18-35. The top line is ethanol alone, the middle line is ethanol with glucose, and the bottom line is ethanol with fructose. The ethanol with or without the sugar was fed in the first three hours. The ethanol was 1.75 grams per kilogram bodyweight, and the sugar, if used, was 1.0 grams per kilogram bodyweight.
This is the bodyweight equivalent of me consuming 125.4 grams of ethanol in three hours, when I had consumed an estimated 43.8 grams over 2.5 hours. Thus, this is 2.9 times the total amount of ethanol I consumed and a consumption rate 2.4 times greater than mine, yet the lactate does not rise much above 1.5 mmol/L until the eight-hour mark. The sugars prevented it from rising primarily in the 12-20 hours after its consumption began, where it rose close to 3.0 mmol/L without the sugars.
The relevant time point, however, is the 2- and 4-hour marks, since I measured my lactate immediately at the end of a 2.5-hour period over which I consumed the beer.
This shows that it is not normal for the amount of ethanol I consumed to raise my lactate to 4.0.
So, what happened?
We can gain a clue from thinking more deeply about the last study. Why did the sugars help prevent the post-ethanol rise in lactate?
Because ethanol is metabolized to acetyl CoA, but cannot be metabolized to oxaloacetate or to any of the citric acid cycle metabolites that could become oxaloacetate. Thus, on its own, it will lead to the accumulation of acetyl CoA.
This accumulation of acetyl CoA makes ethanol ketogenic, which is why alcohol abuse can lead to alcoholic ketoacidosis (Lesson 36).
Acetyl CoA inhibits pyruvate dehydrogenase (Lesson 24), which prevents pyruvate from being burned for energy. This increases the accumulation of pyruvate, which allows more and more ethanol to be turned into acetaldehyde, creating more and more NADH, which turns the more and more pyruvate into more and more lactate.
Now, bring in the sugars.
Unlike ethanol, glucose and fructose can generate oxaloacetate through the pyruvate carboxylase reaction.
Through the what?
The pyruvate carboxylase reaction!
Thus, the biotin-dependent enzyme pyruvate carboxylase is the most potent weapon to use against an ethanol-induced rise in lactate. Most people are using this enzyme for this purpose even if they haven’t eaten any carbohydrate while drinking (unusual!) because they are tapping into their stored carbohydrate.
So, if you are deficient in pyruvate carboxylase, whether because of your genes, your oxalates, or your biotin status, you should have an abnormally high lactate response to ethanol.
Thus, I propose this is exactly why my lactate rose so high.
Did the Beer Contribute to My Peripheral Neuropathy on August 10?
I was unable to provoke more than the most trivial sense of peripheral neuropathy on February 3 despite my best efforts.
However, I weighed 155.7 pounds on August 10, 2022, and I weighed 157.7 pounds on February 3, 2022. The difference is small, but this is consistent with my hypothesis that my brain has made my set point hover with surprising precision around the tipping point of the minimum necessary assistance I need for my energy metabolism from leptin.
Based on my experiment, is it likely the beer played a role in the peripheral neuropathy on August 10?
Absolutely.
Consider these points:
The function of nerves is in every single conceivable way extremely dependent on ATP.
If my pyruvate carboxylase is deficient because of my biotin status, my ATP production is compromised.
ATP declines in the fasting state, and for me the decline would be worse.
That ethanol produces such an outsized lactate reaction in me suggests that it plays a proportionally outsized role in sapping my energy metabolism.
The failure to metabolize the acetyl CoA would back up the aldehyde dehydrogenase reaction and lead to the accumulation of the toxic intermediate, acetaldehyde, leading to greater toxicity.
The CoA sequestration would hurt the ability to burn fatty acids and many amino acids for energy.
The acetyl CoA would directly inhibit the use of carbohydrate for energy by inhibiting pyruvate dehydrogenase.
Electrons are inefficiently funneled into lactate production because they can’t find their way to the respiratory chain. Nearly every other aspect of energy metabolism is shut down.
Of course, it was the undereating that potentiated this response to the ethanol.
Then I ate, and things got better.
Specifically, I ate a burger, and the protein provided enough biotin-sparing amino acids to get the citric acid cycle rolling. To the extent my pyruvate carboxylase has some activity, the carbohydrate in my meal would also help. Suddenly, the acetyl CoA gets utilized, the CoA sequestration stops, the acetaldehyde starts getting metabolized again, and electrons start moving to the respiratory chain instead of to lactate. ATP concentrations increase, and nerves start functioning normally.
The Bottom Line
The most abnormal aspects of my metabolism are these:
A paradoxical rise in lactate after an 18-hour fast that is paradoxically suppressed by eating mixed meals, and might even be mildly suppressed by 30 grams of carbohydrate.
15 minutes of mild paradoxical postprandial ketogenesis in response to 30 grams of carbohydrate after an 18-hour fast.
Alcohol increases my lactate dramatically more than would be expected, at least when I have been undereating.
Two less glaring but interesting abnormalities in my metabolism are these:
My levels of ketones seem higher than I would expect for my diet, and they paradoxically increase across the day when I eat normally, regularly spaced meals.
The ability of protein to suppress my glycemic response to pure dextrose in water is considerably less than would be expected.
These are all consistent with mild pyruvate carboxylase deficiency secondary at least in part to poor biotin status.
This conclusion is corroborated by the data I laid out in Getting to the Bottom of My Health: Biotin and V(L)CAD. In particular:
My biotin status was low and declining throughout this period.
As it declined, my aspartate fell from flagged low to undetectable.
As it declined, my urinary ketones also shot through the roof until the glucose tolerance tests brought them down from insanely high to merely out of range high.
My urinary ketone ratio was highly oxidized, as would be expected from pyruvate carboxylase deficiency leading to an excess of mitochondrial NAD+ and deficiency of mitochondrial NADH (if you find this very confusing given the discussion of lactate above, ask questions in the comments).
I have revised my hypothesis about biotin and glucose tolerance. I no longer believe that biotin deficiency will make protein become obviously protective against glucose tolerance. Rather, my current hypothesis is that biotin deficiency causes a partial loss of this effect that makes a greater amount of protein required to show the effect.
Normally, this effect requires at least one gram of protein for every two grams of carbohydrate.
In a state of biotin deficiency, I now propose that at least one gram of protein for every one gram of carbohydrate is needed to manifest this phenomenon.
Keeping in mind, of course, that protein does not fix biotin deficiency and in fact protein raises the biotin requirement.
I do not recommend anyone do repeated glucose tolerance tests at home. I also cannot take responsibility for anyone’s self-experiments. However, for those who wish to investigate these matters in themselves, I believe that looking for paradoxical postprandial ketogenesis and lactate suppression after an 18-hour fast and examining the lactate response to alcohol in the context of undereating may be very valuable, relatively inexpensive home tests that can be done. I would modify my approach here by looking for the increase in ketones at the 5-minute, 10-minute, and 15-minute marks rather than the 15-minute mark only.
Moving Forward
Within one to two weeks, I will be able to write up my experience with 5 weeks of high-dose biotin supplementation.
I will be looking for evidence that loading 10 milligrams per day for this time period has optimized my biotin status, especially a normal serum biotin and a normal tissue saturation, indicated by normal “apparent absorption” of 107 micrograms of biotin. I will also be looking for normalization of my blood levels of aspartate as the chief relevant functional marker of pyruvate carboxylase activity.
If I discover evidence that I am still biotin deficient, my next step may be to dramatically increase the dose.
If I discover that I am now biotin-sufficient, my next step will be to consider whether ACAD9, VLCAD, or LCAD deficiencies represent the most logical next target.
Tools I Used For This Project
I used the following tools for this project:
KetoMojo ketone and glucose meter.
NovaBiomedical Lactate Plus
Random.Org for randomizing.
GraphPad Prism for statistics and graphs.
Apple Notes and Google Sheets for Data. I am very unhappy with Apple Notes. Please recommend privacy-protective alternatives for notes and data with automatic time-stamping and permanent edit histories in the comments.
Other Posts About My Health
If you found this article useful, you may also find these other articles about my health useful:
Other Posts About Biotin
If you found this article useful, you may also find these other articles about biotin useful:
My simple food-based recommendations for getting enough biotin are found in my Cliff Notes (free for Masterpass members here).
My Energy Metabolism class can make sense out of all the biochemical gobbledigook herein.
What Do You Think?
Did you learn any insights from this that you think may help you on your own health journey? Please share them in the comments!
Join the Next Live Q&A
Have a question for me? Ask it at the next Q&A! Learn more here.
Join the Masterpass
Masterpass members get access to premium content (preview the premium posts here), all my ebook guides for free (see the collection of ebook guides here), monthly live Q&A sessions (see when the next session is here), all my courses for free (see the collection here), and exclusive access to massive discounts (see the specific discounts available by clicking here). Upgrade your subscription to include Masterpass membership with this button:
Learn more about the Masterpass here.
Please Show this Post Some Love
Please like and share this post on the Substack web site. This will help spread it far and wide, as subscriber likes drive the Substack algorithm. Likes from paid subscribers count the most, but likes from free subscribers come in the highest numbers and are the foundation for spreading the content.
Take a Look at the Store
At no extra cost to you, please consider buying products from one of my popular affiliates using these links: Paleovalley, Magic Spoon breakfast cereal, LMNT, Seeking Health, Ancestral Supplements, MASA chips. Find more affiliates here.
For $2.99, you can purchase The Vitamins and Minerals 101 Cliff Notes, a bullet point summary of all the most important things I’ve learned in over 15 years of studying nutrition science.
For $10, you can purchase The Food and Supplement Guide for the Coronavirus, my protocol for prevention and for what to do if you get sick.
For $10, you can purchase Healing From COVID Vaccine Side Effects for yourself or a loved one if dealing with this issue. It also contains an extensive well-referenced scientific review, so you can also use this just to learn more about my research into the COVID vaccines.
For $29.99, you can purchase a copy of my ebook, Testing Nutritional Status: The Ultimate Cheat Sheet, my complete system for managing your nutritional status using dietary analysis, a survey of just under 200 signs and symptoms, and a comprehensive guide to proper interpretation of labwork.


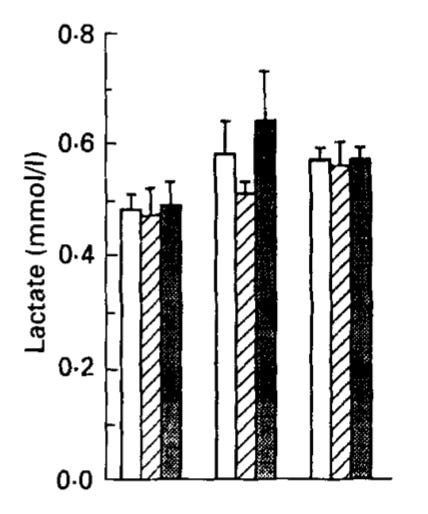

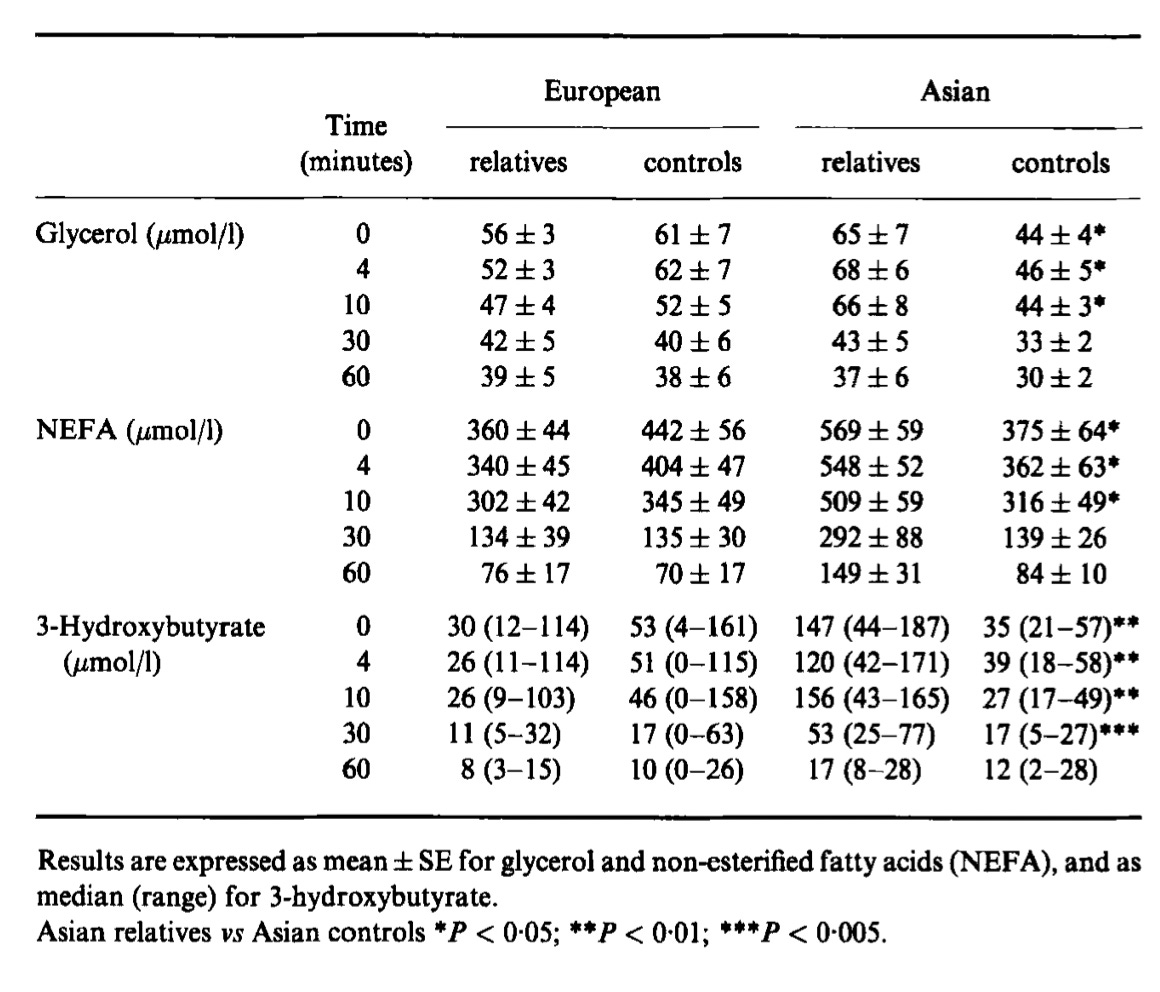
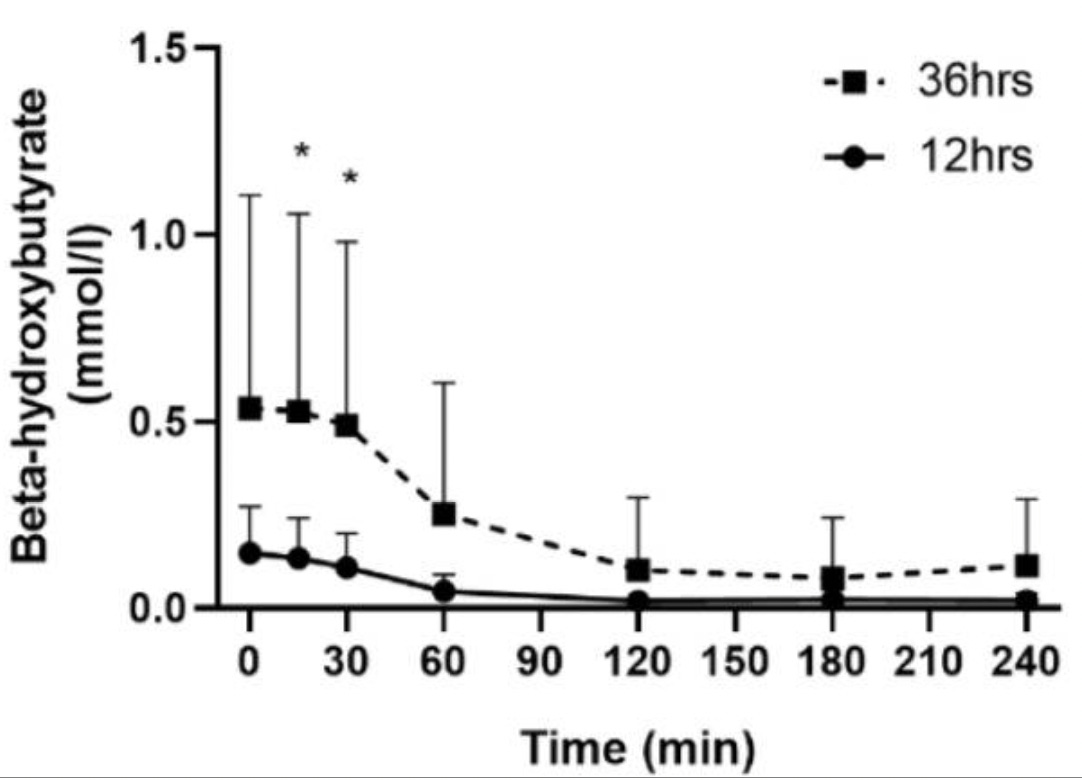


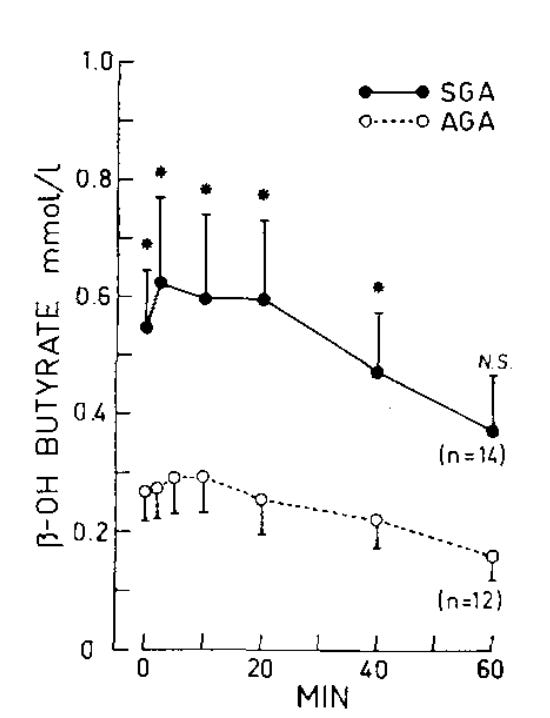

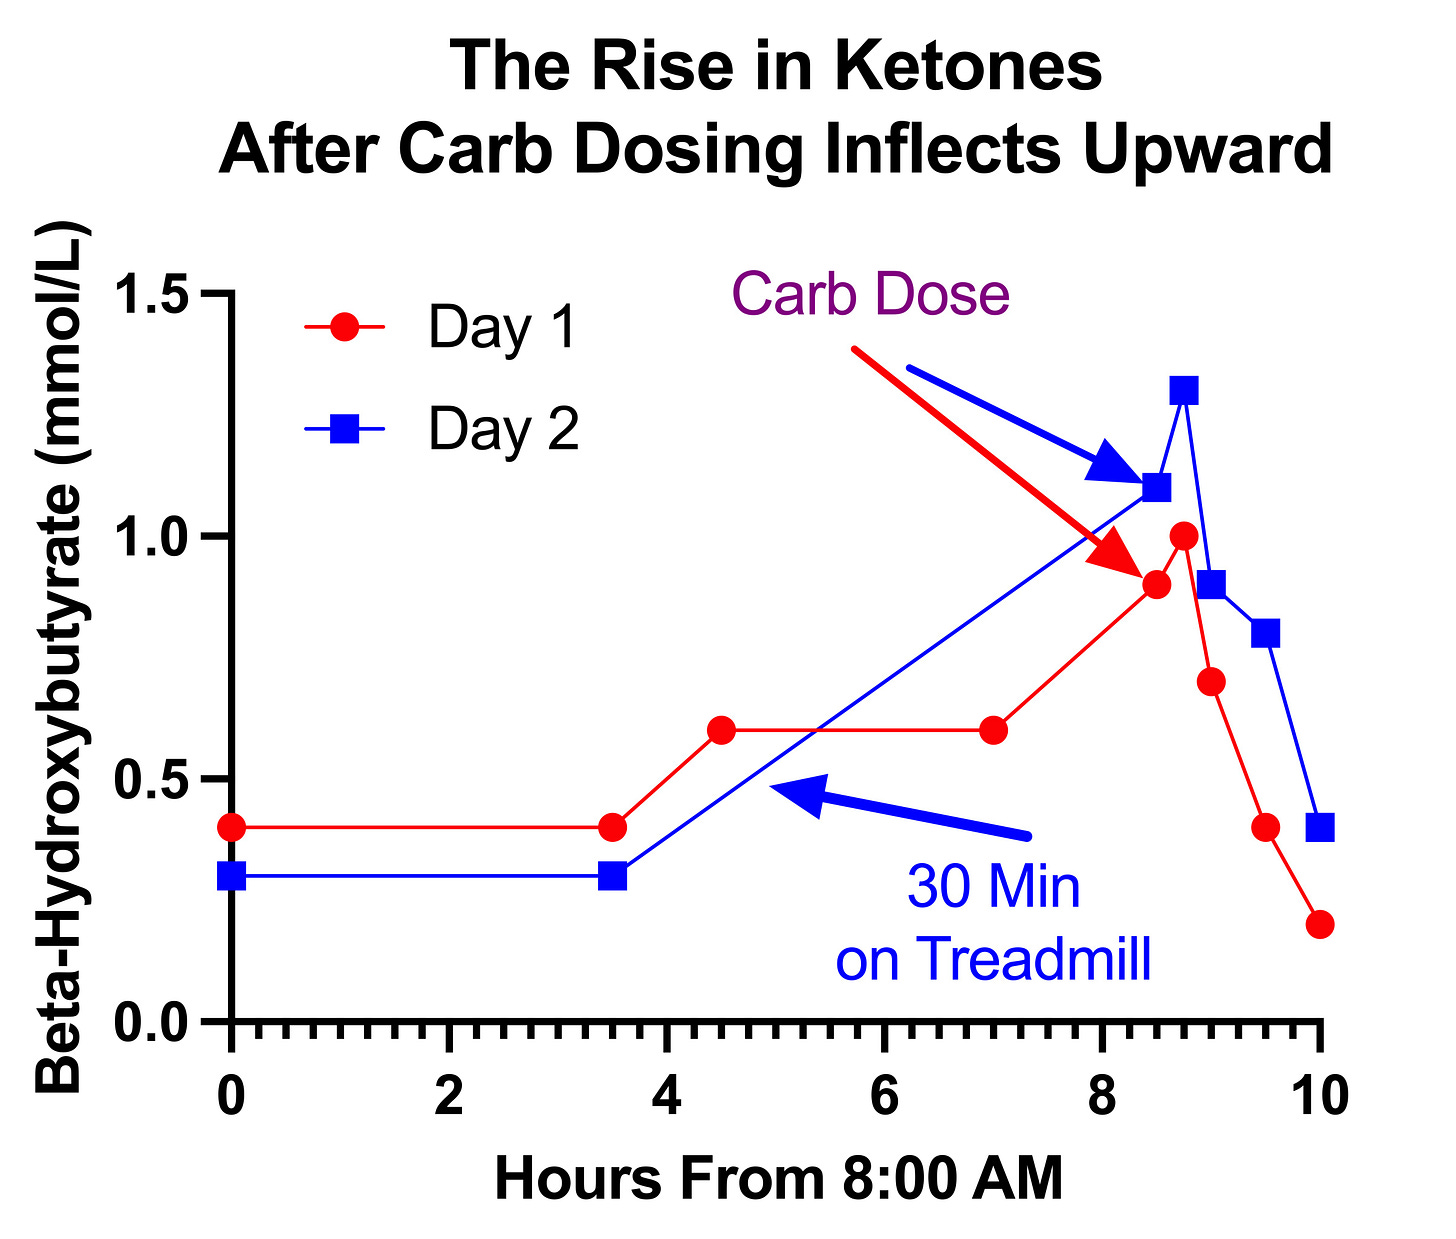
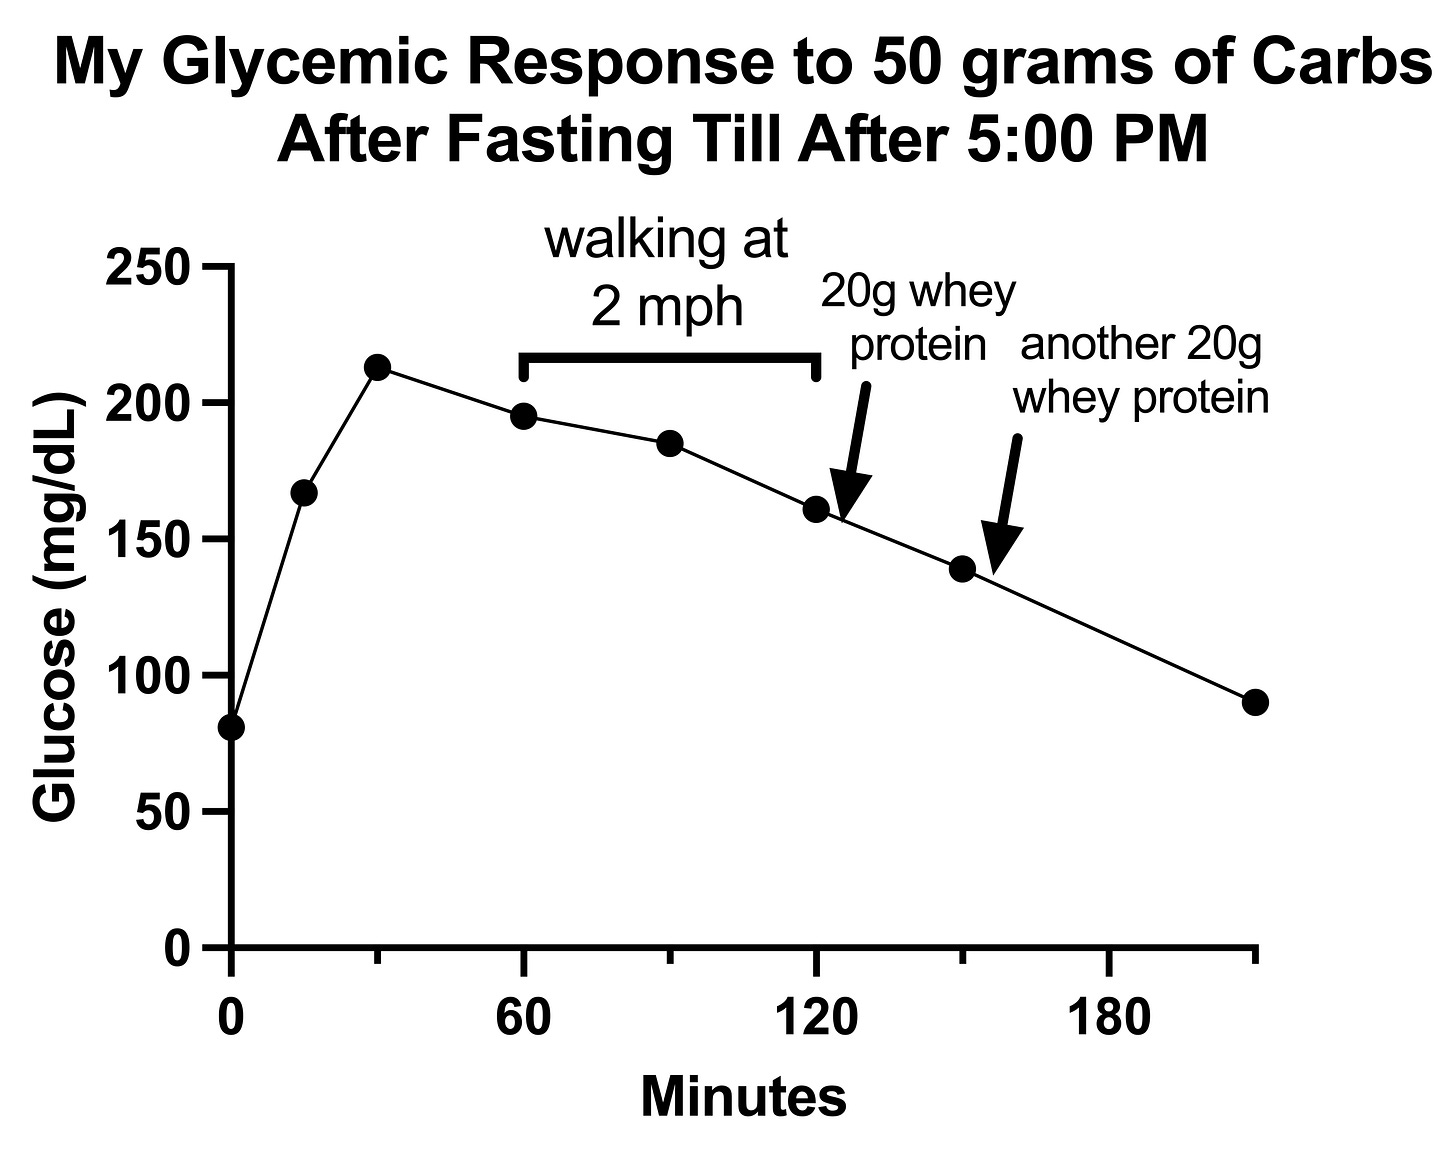
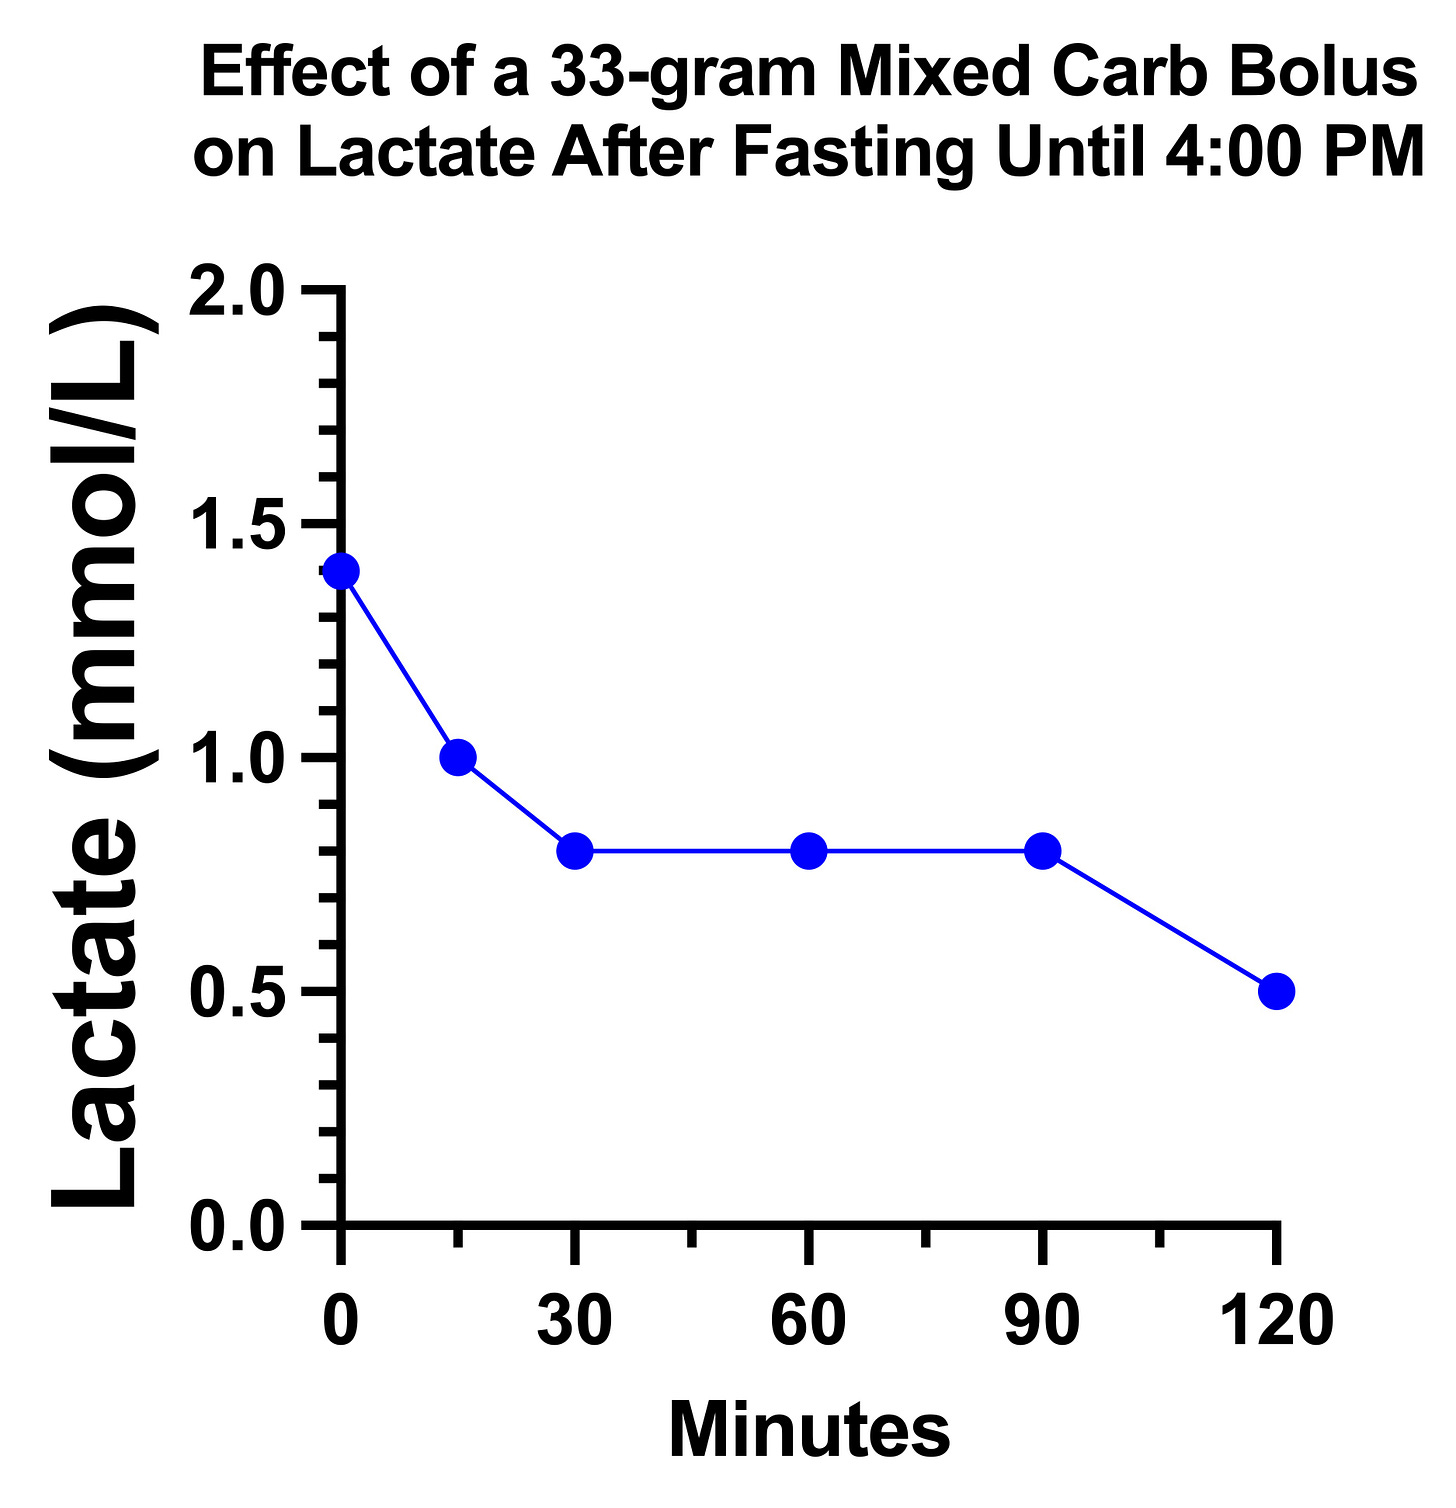
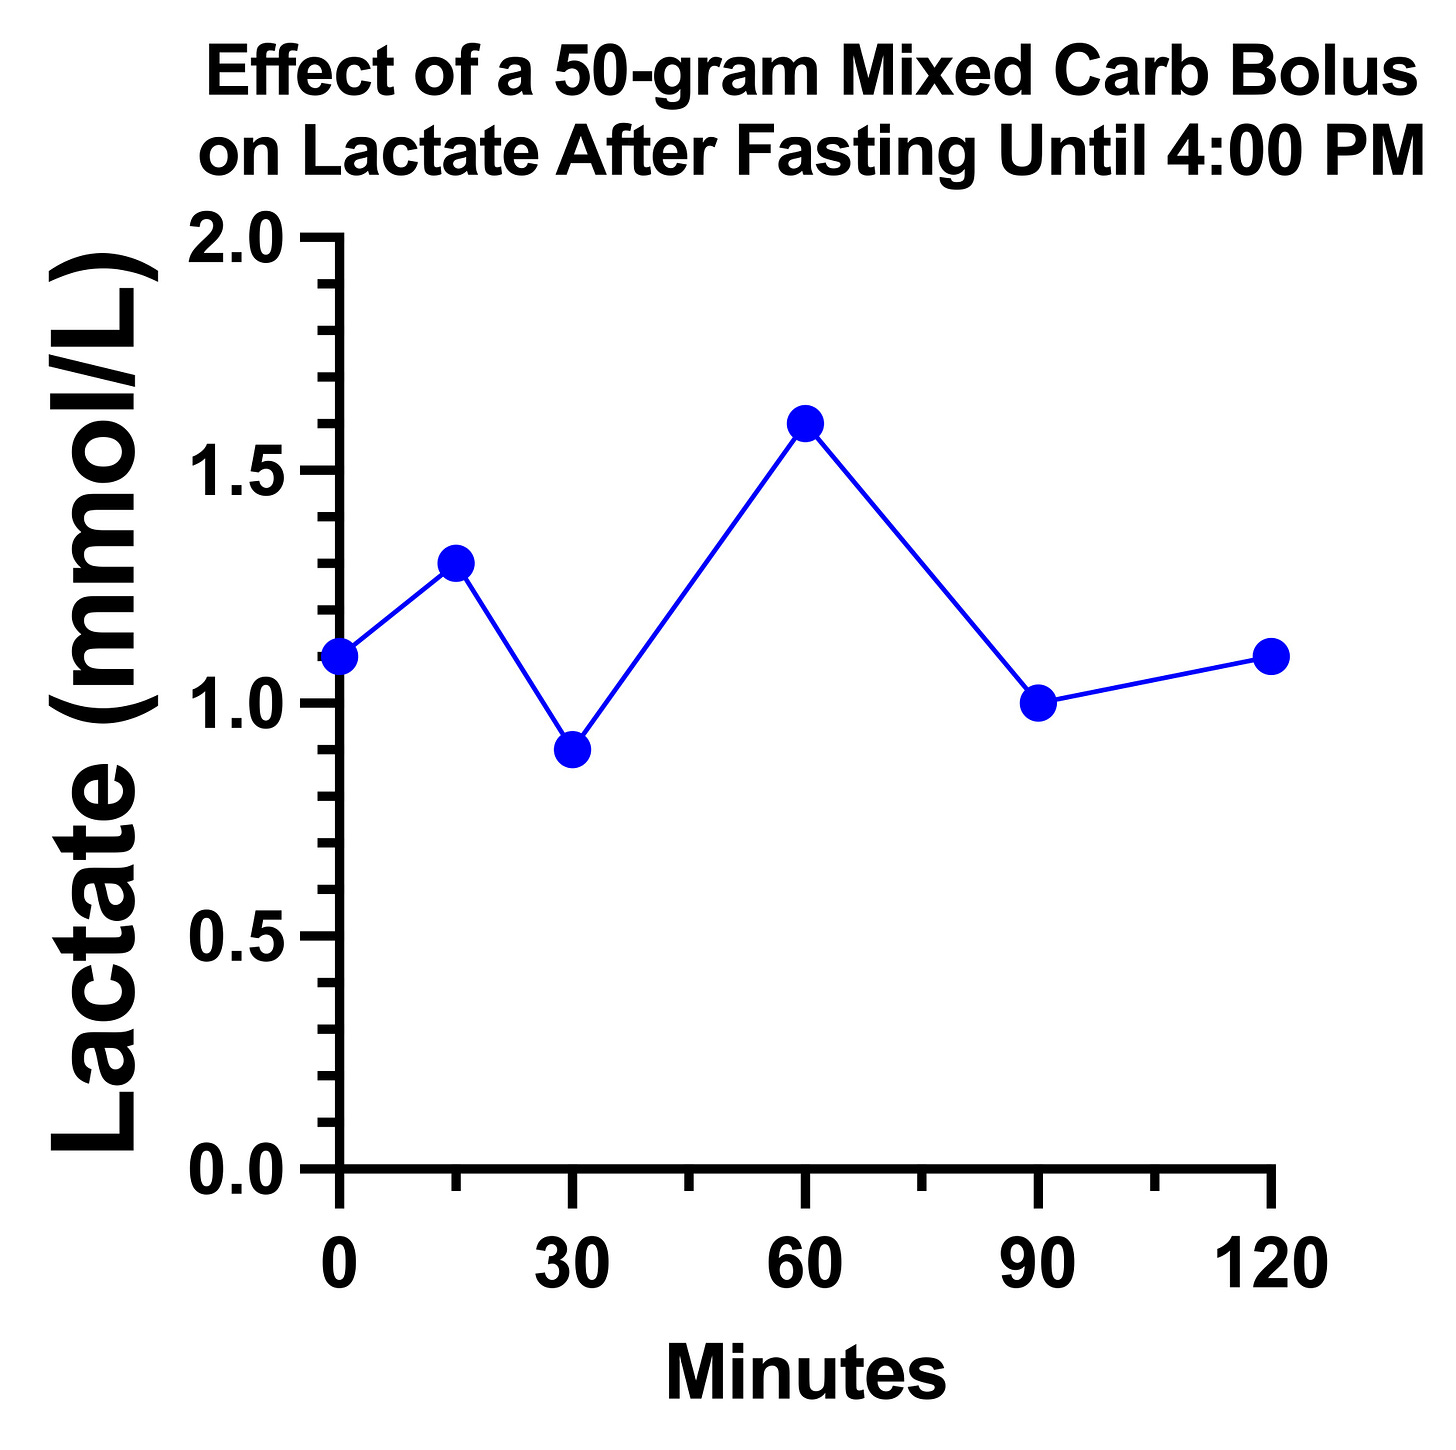
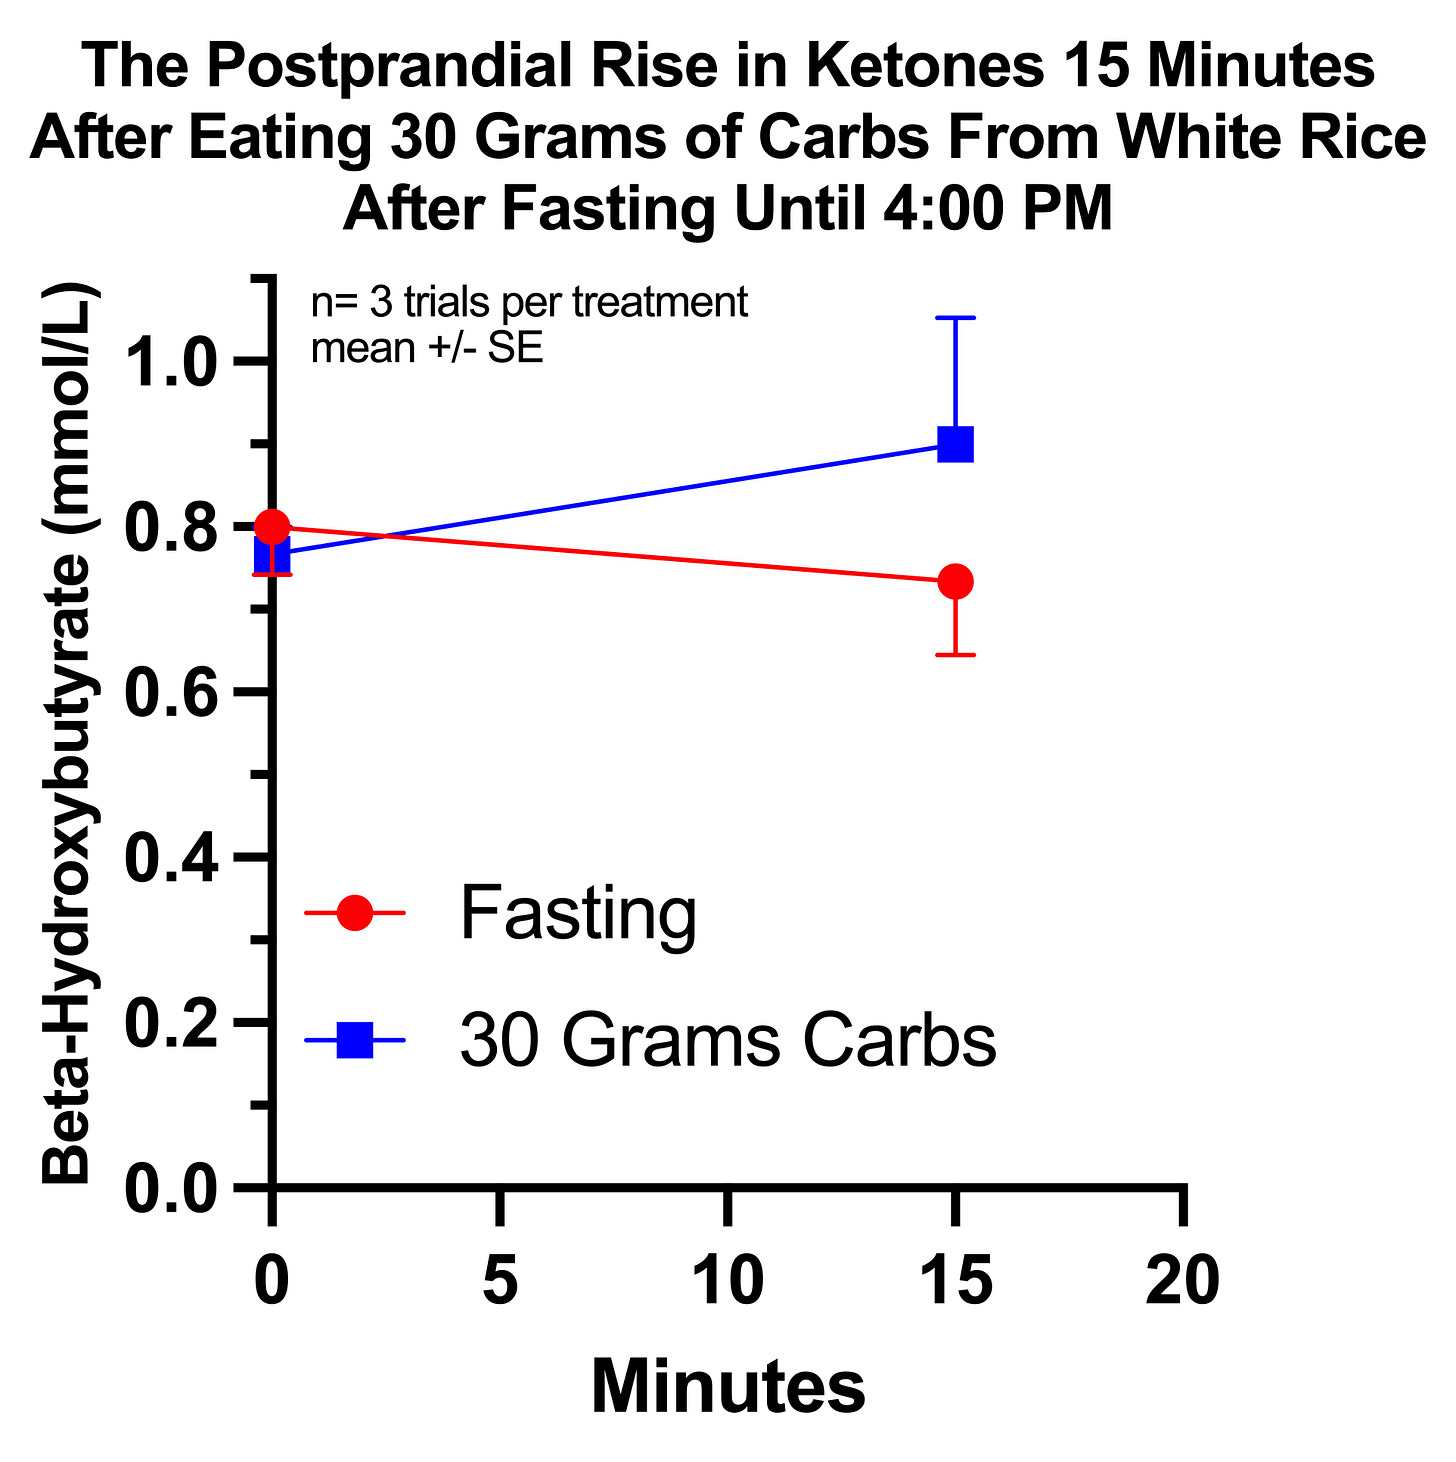
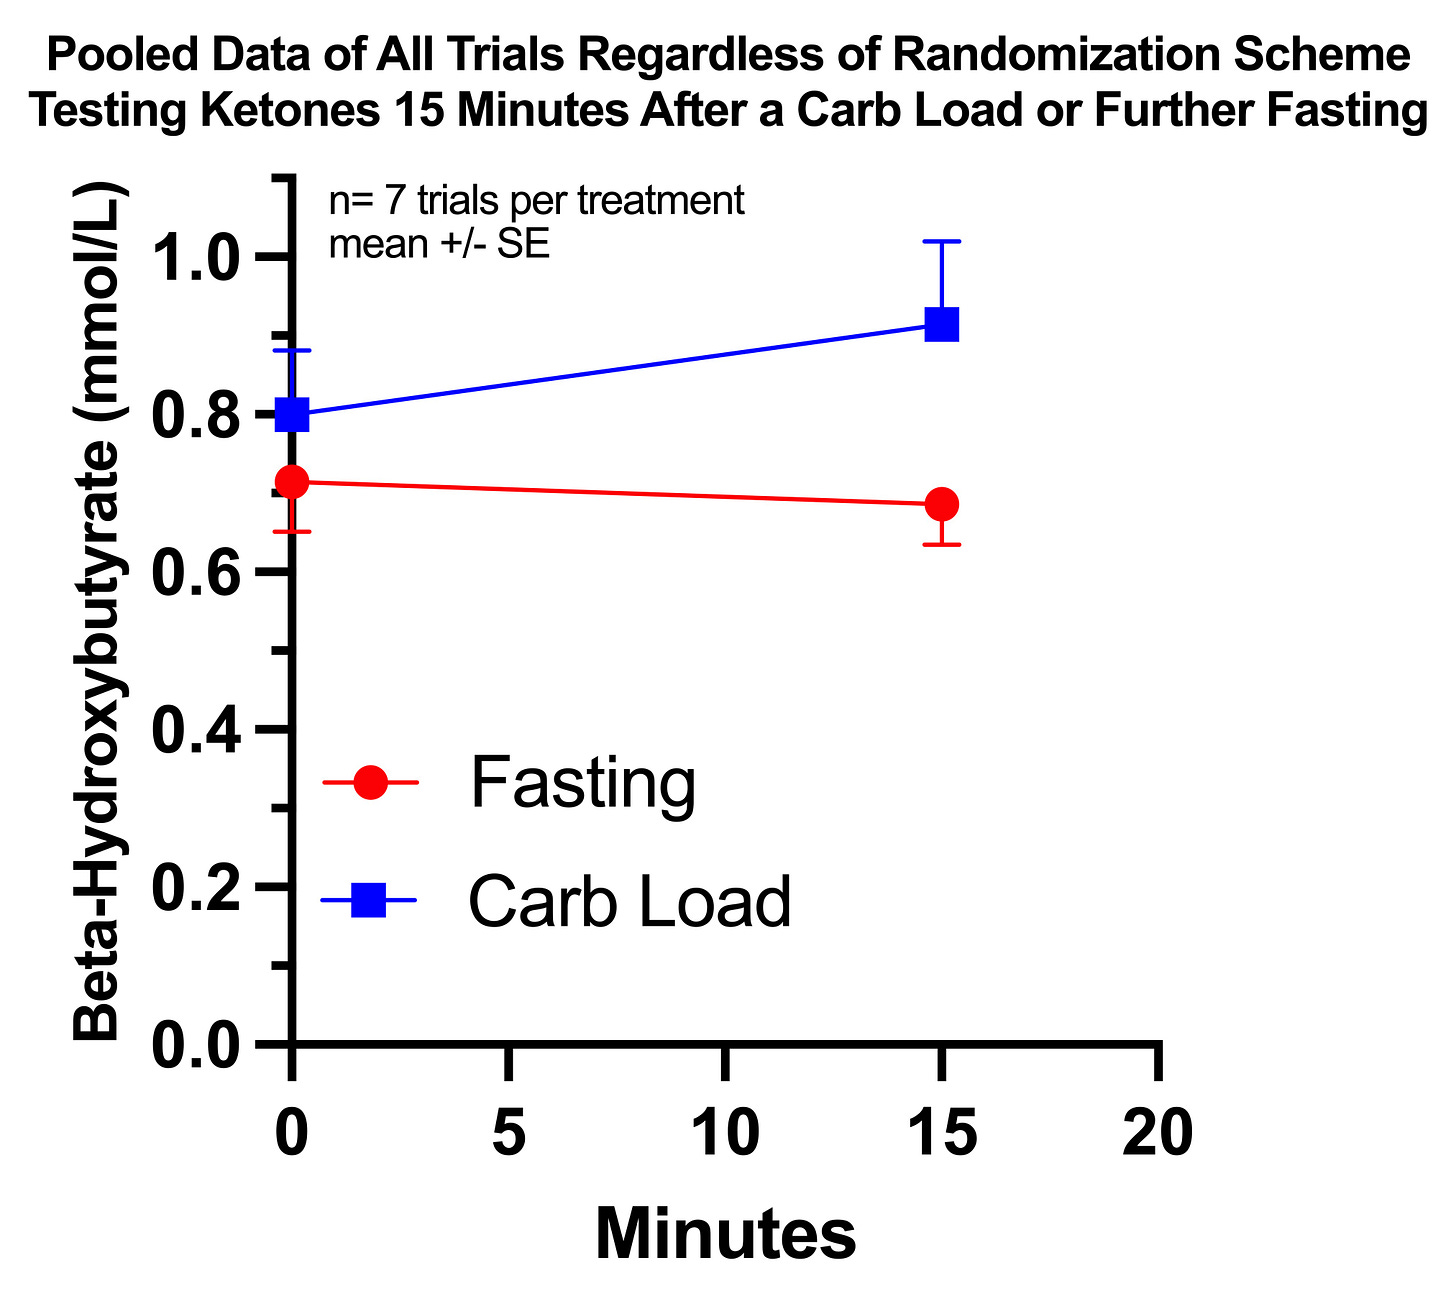


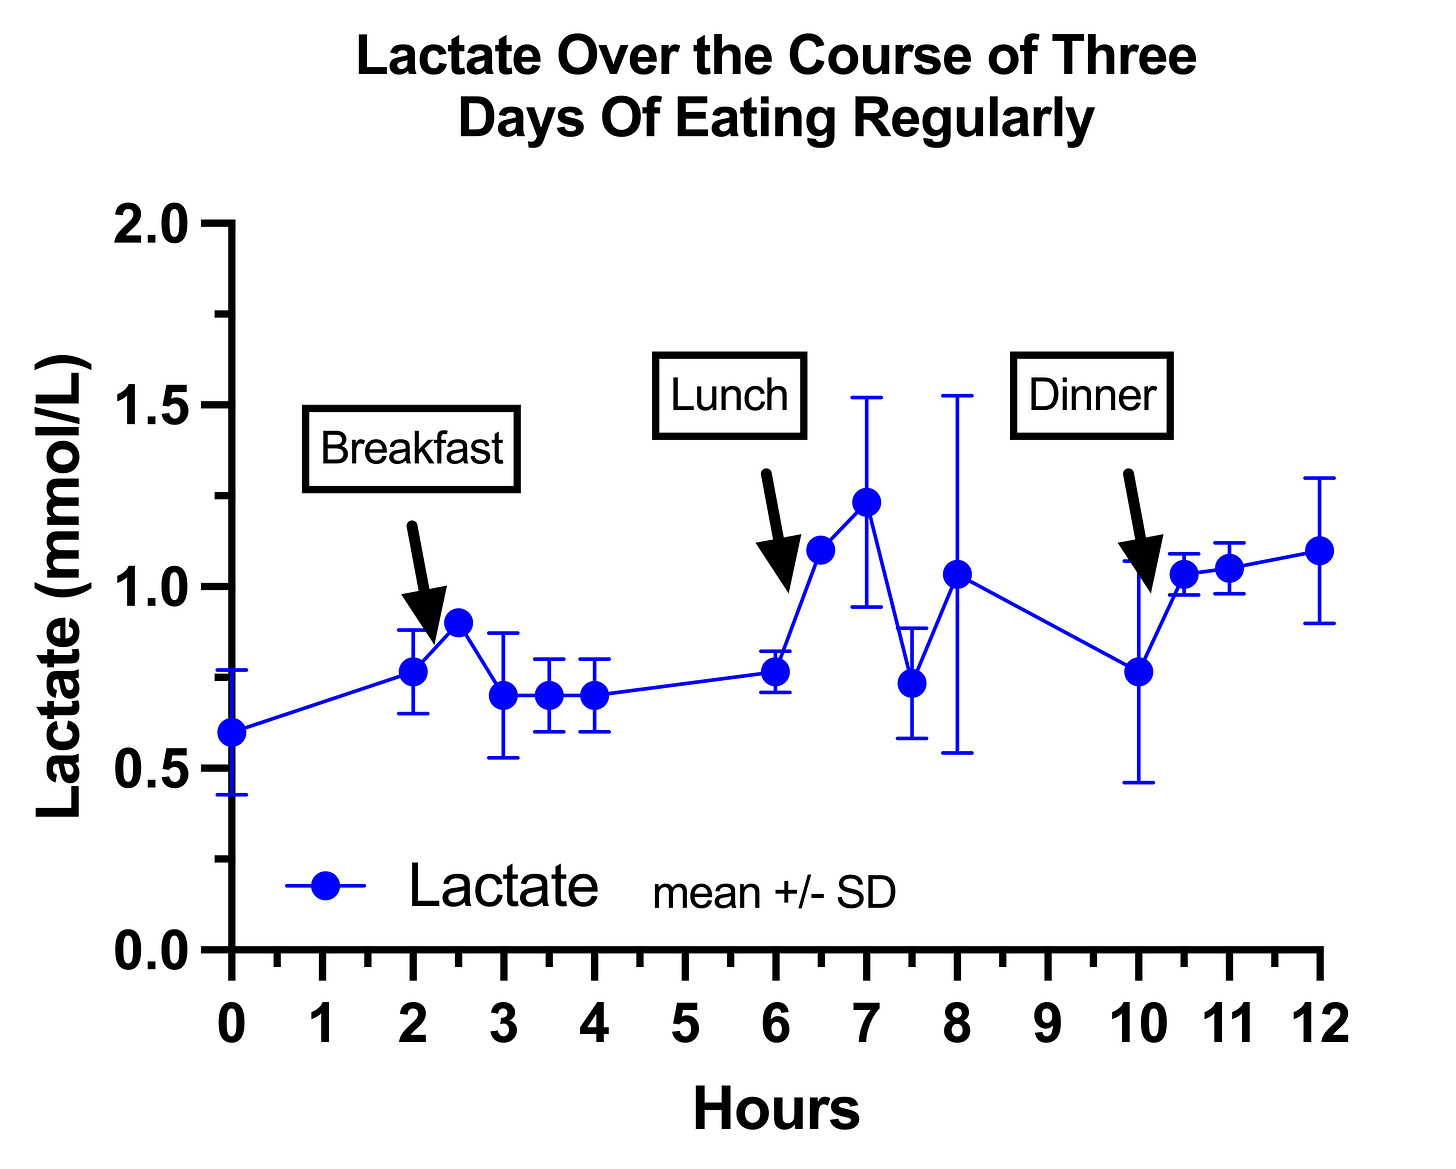


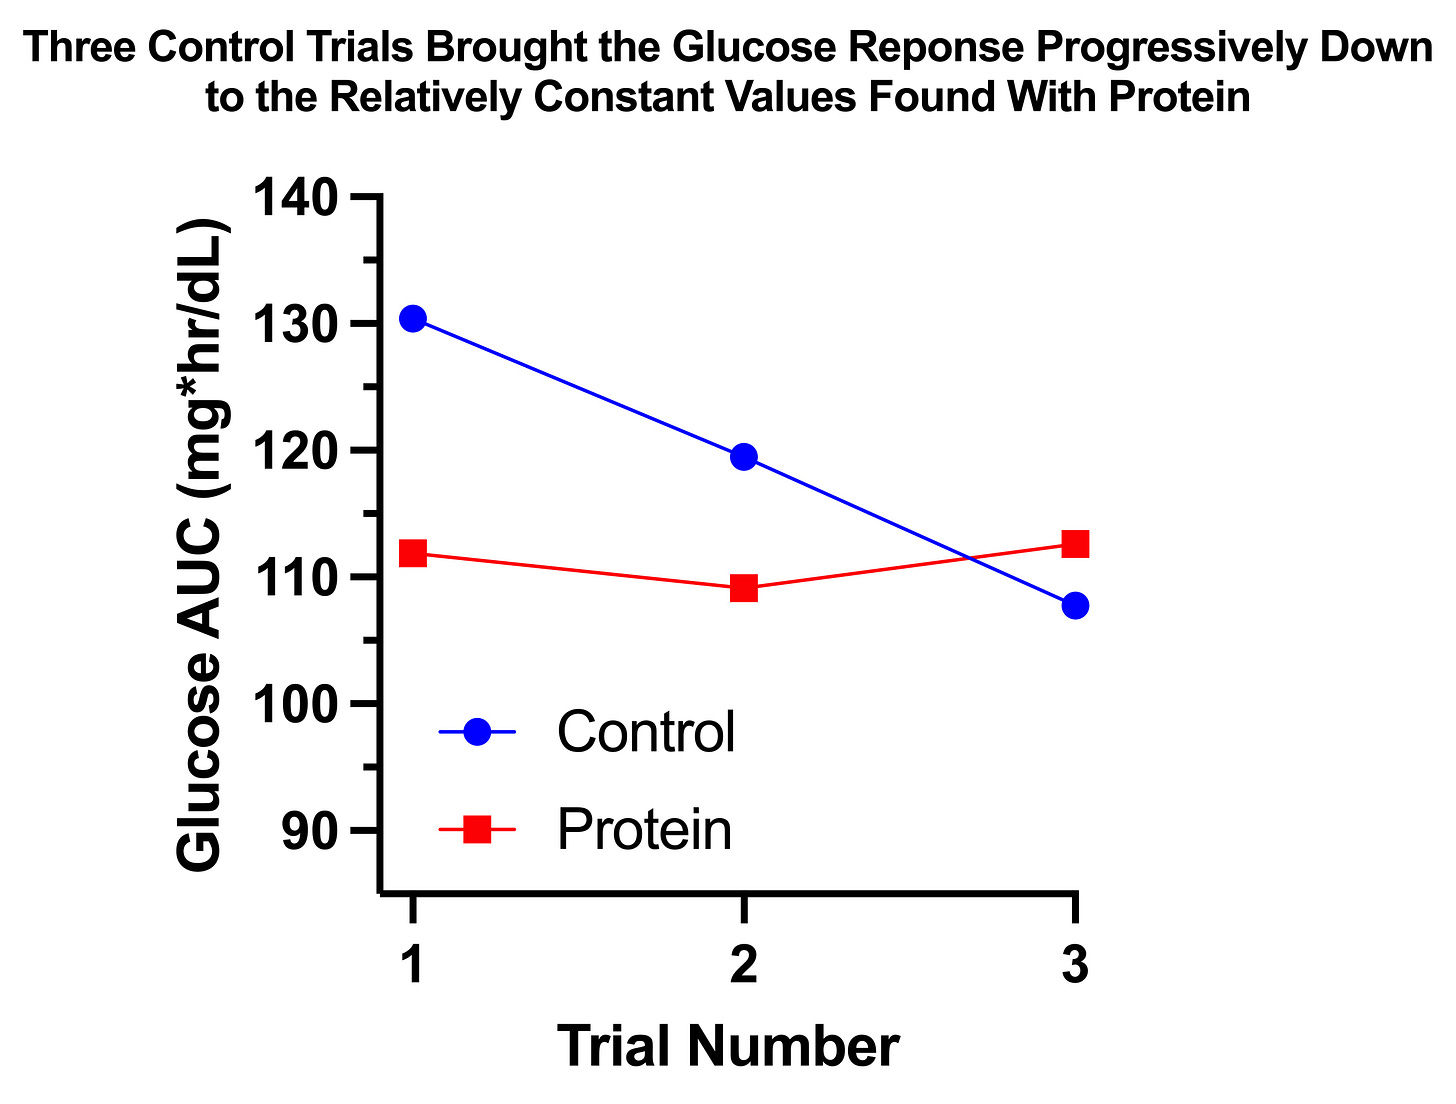
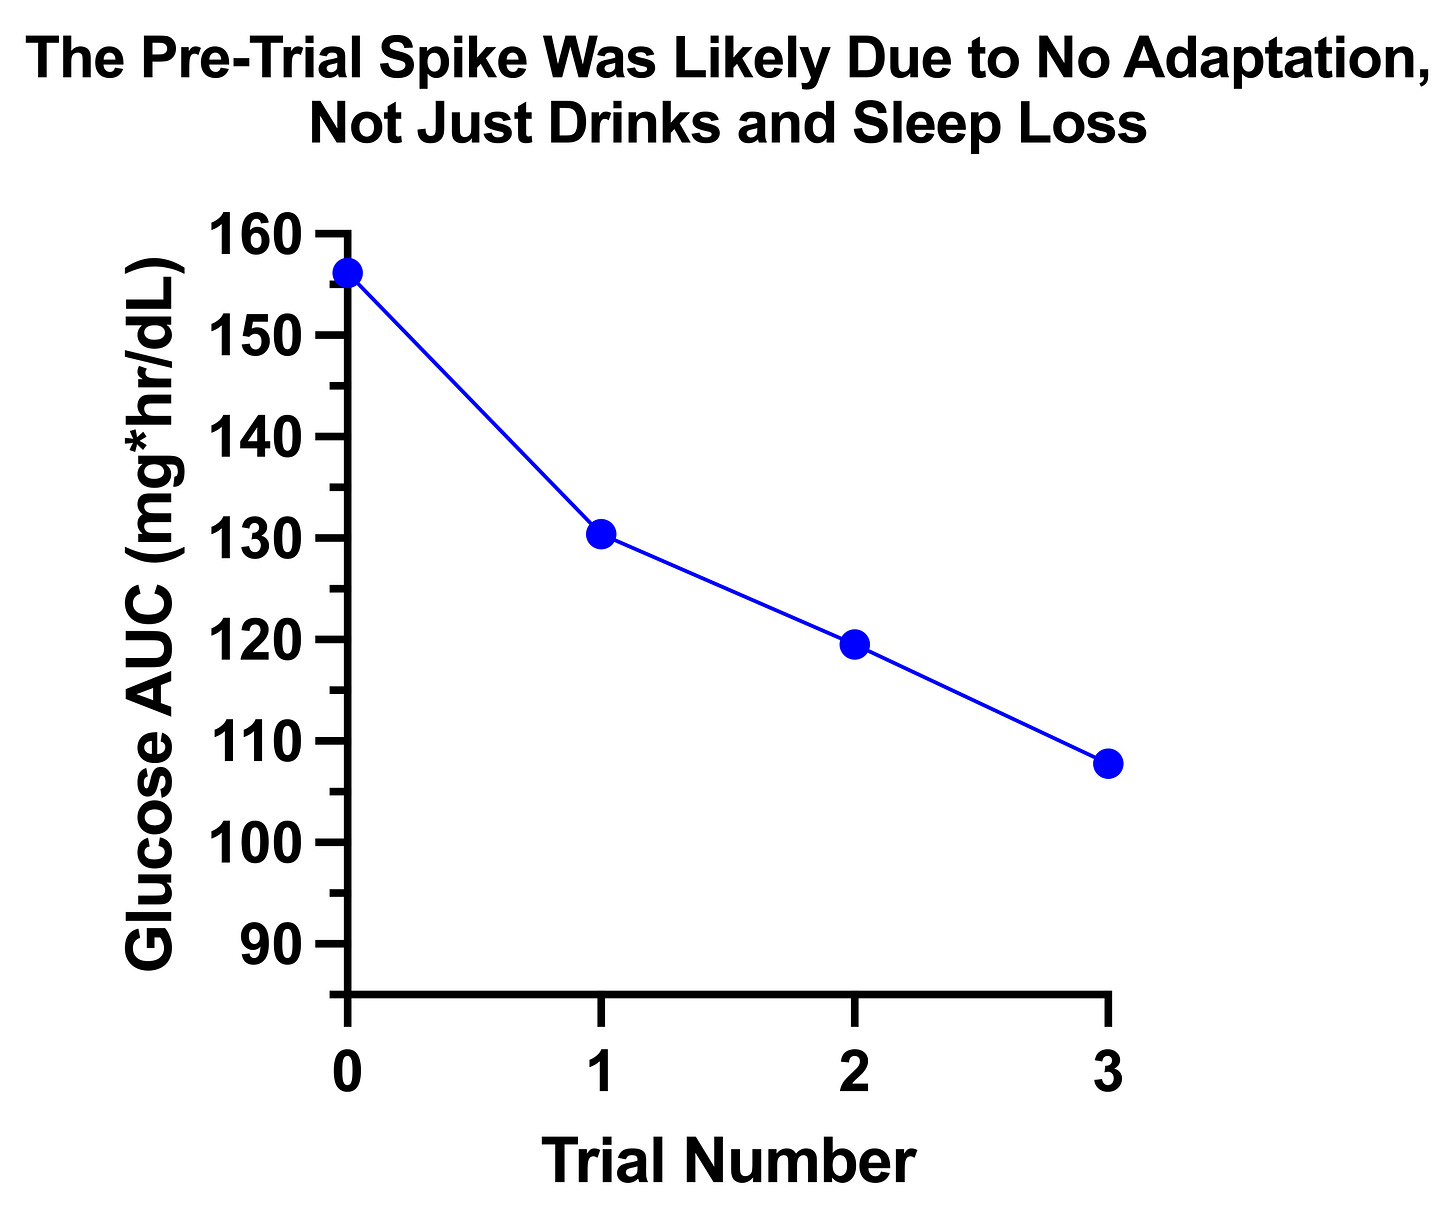
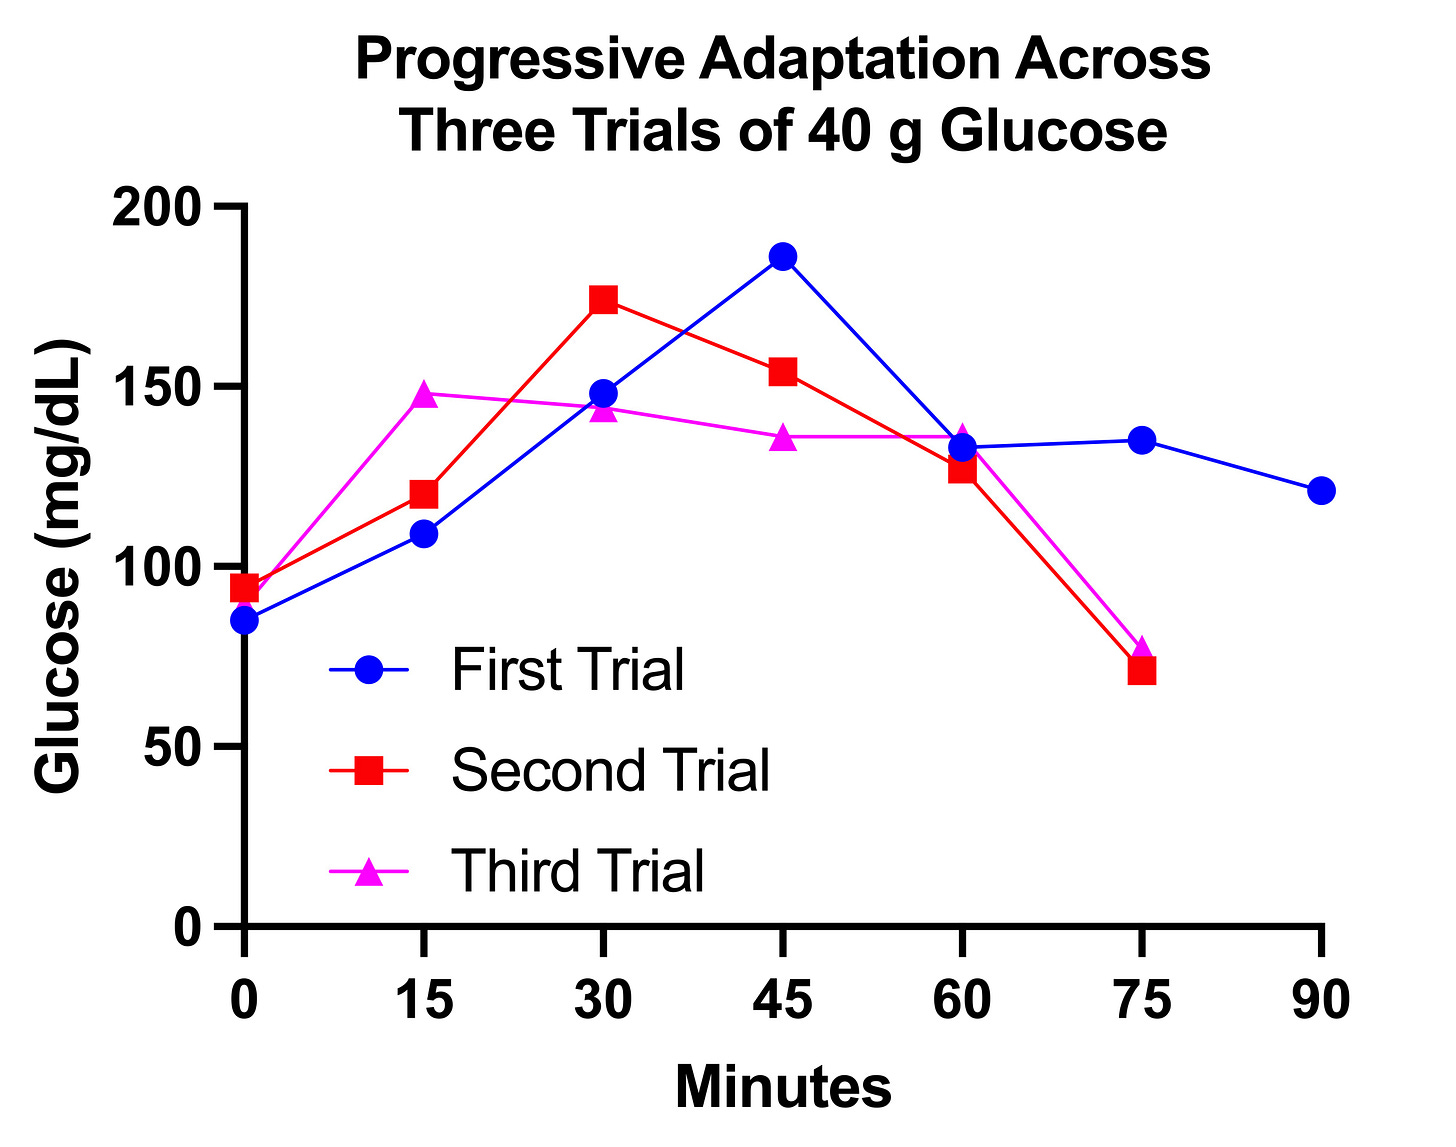
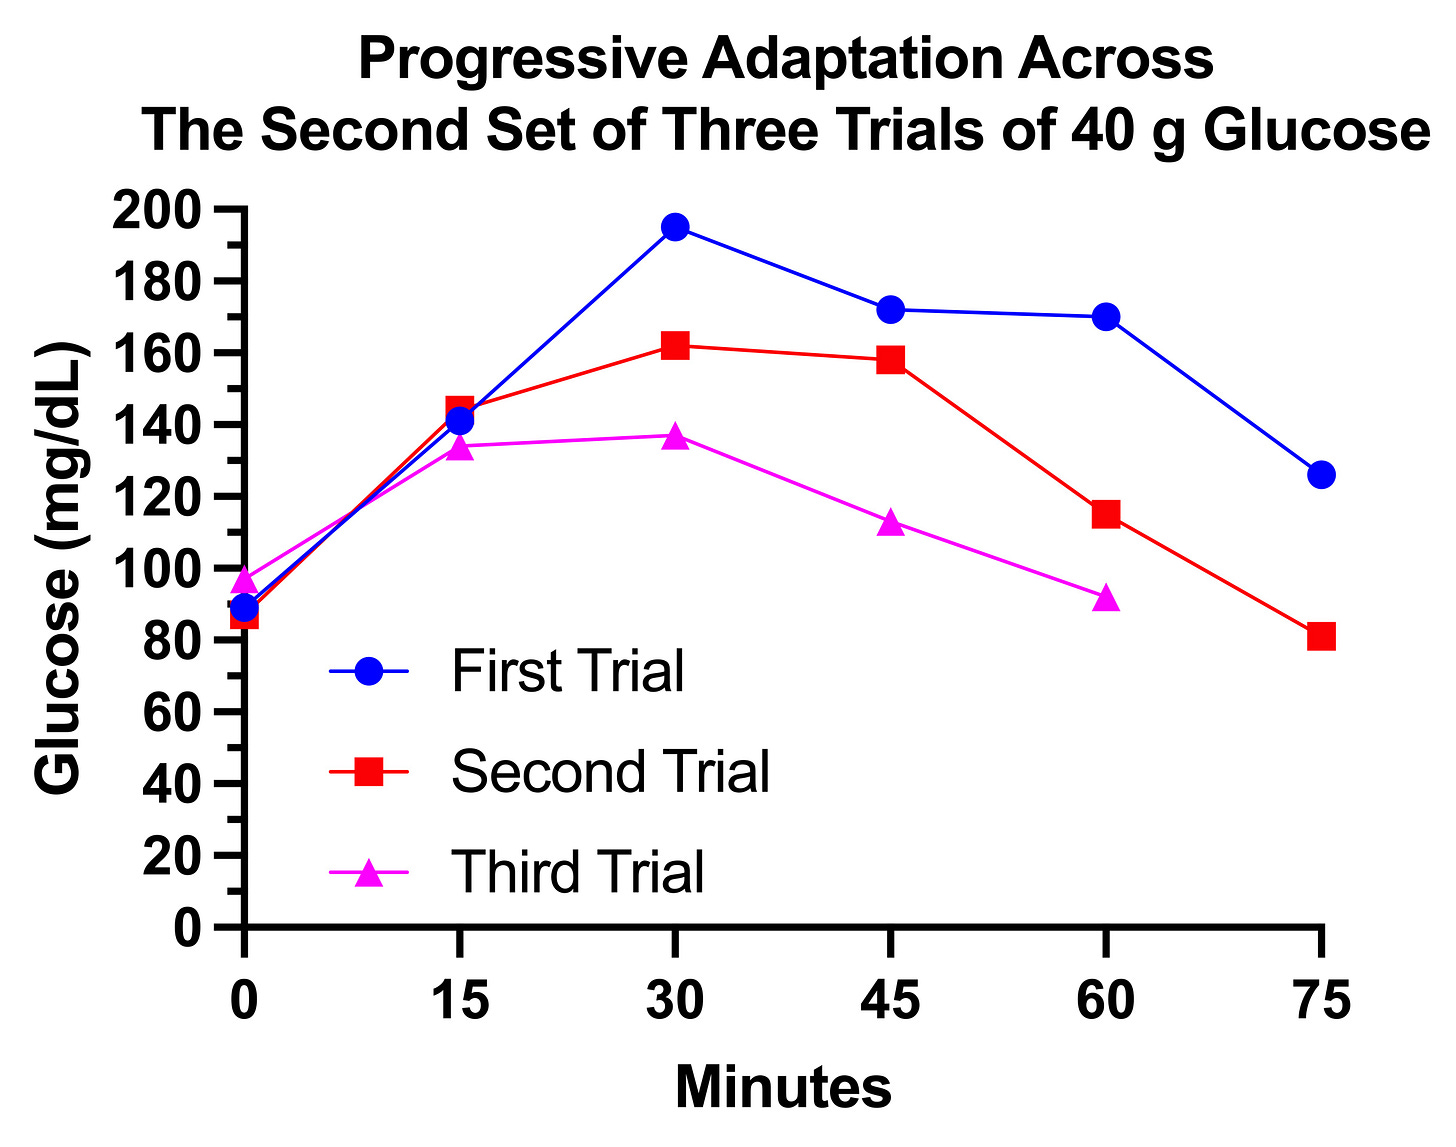


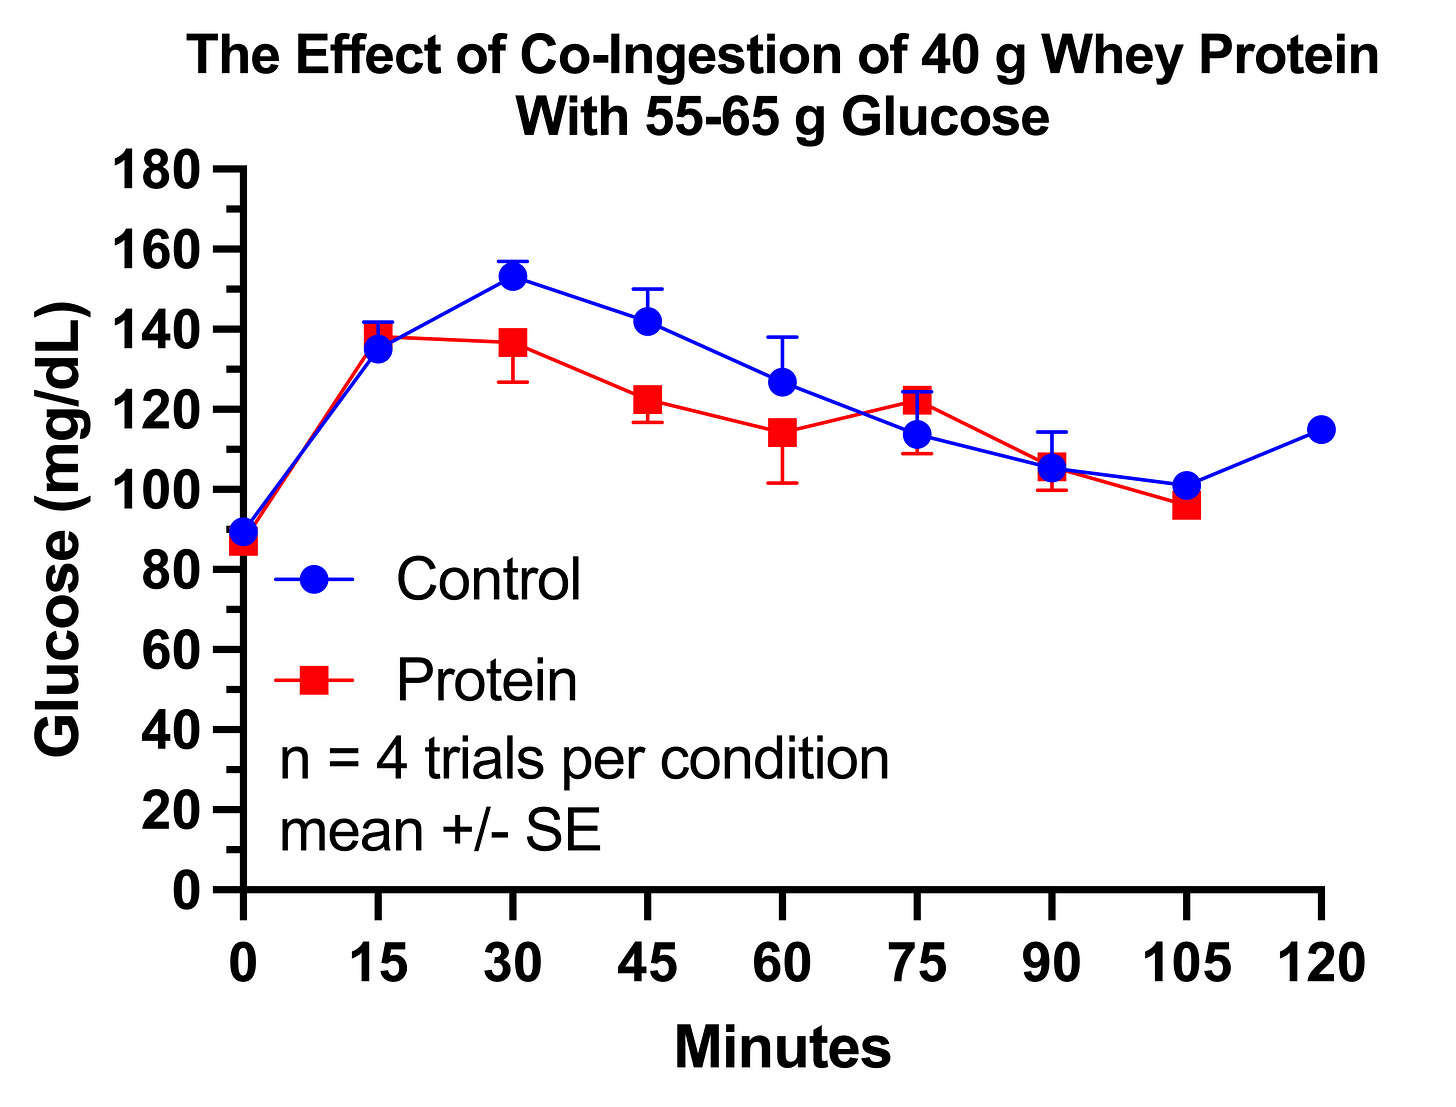
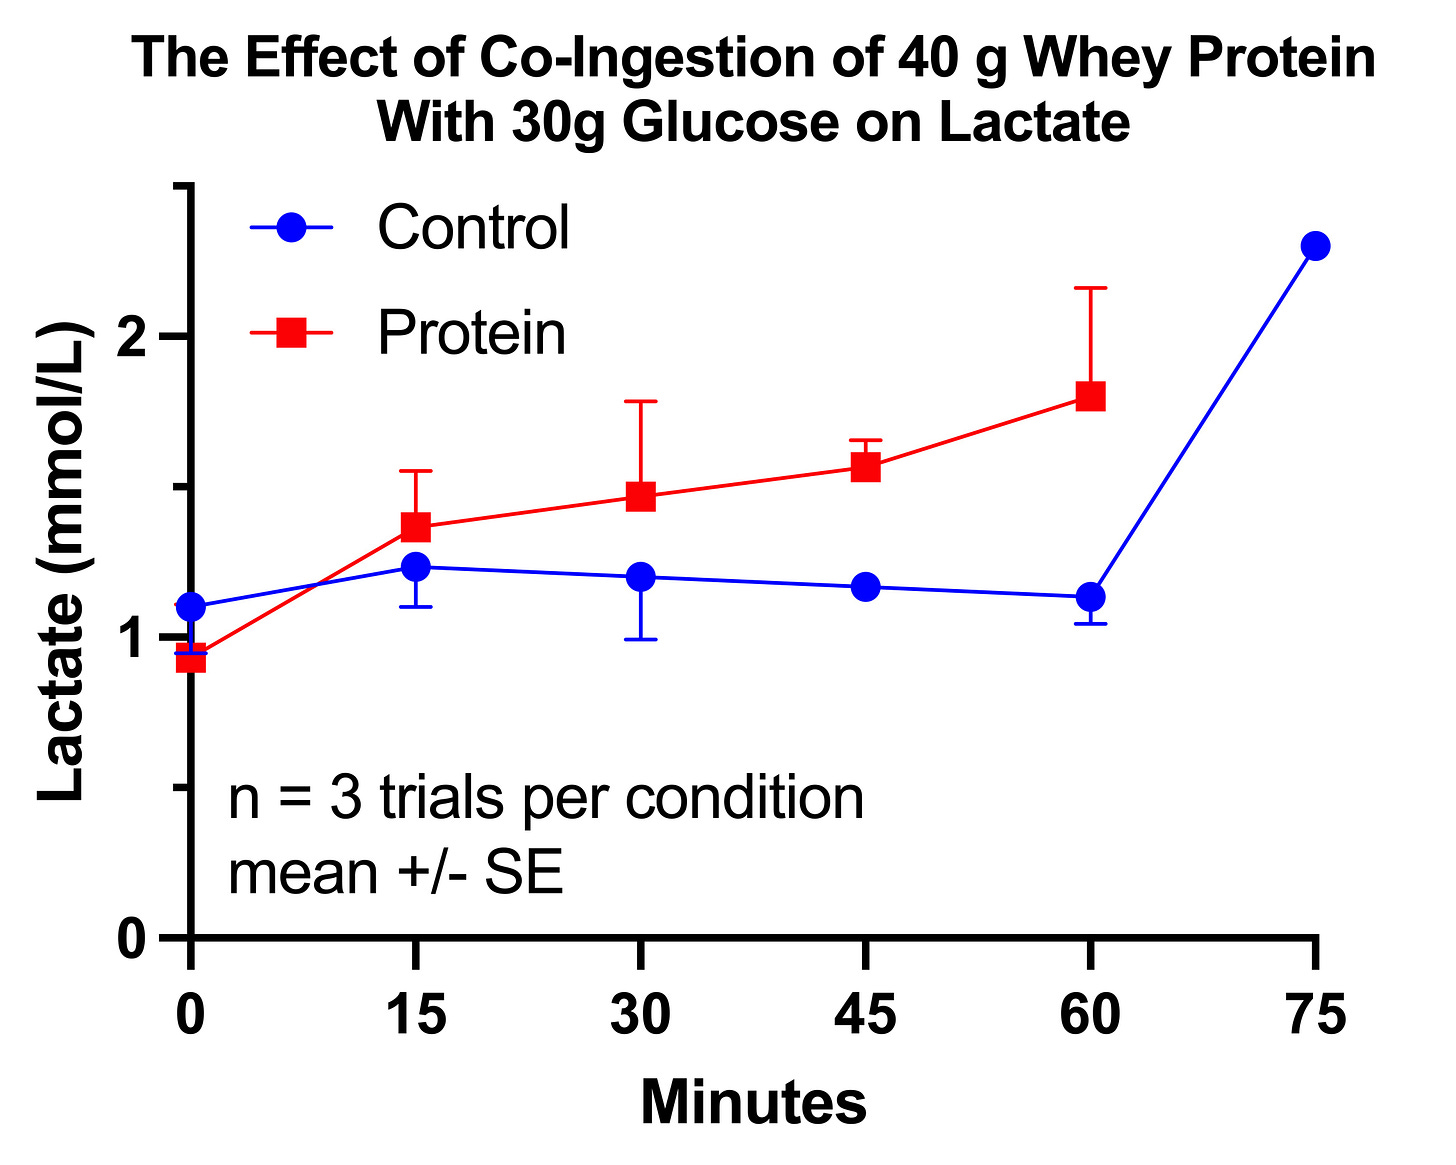
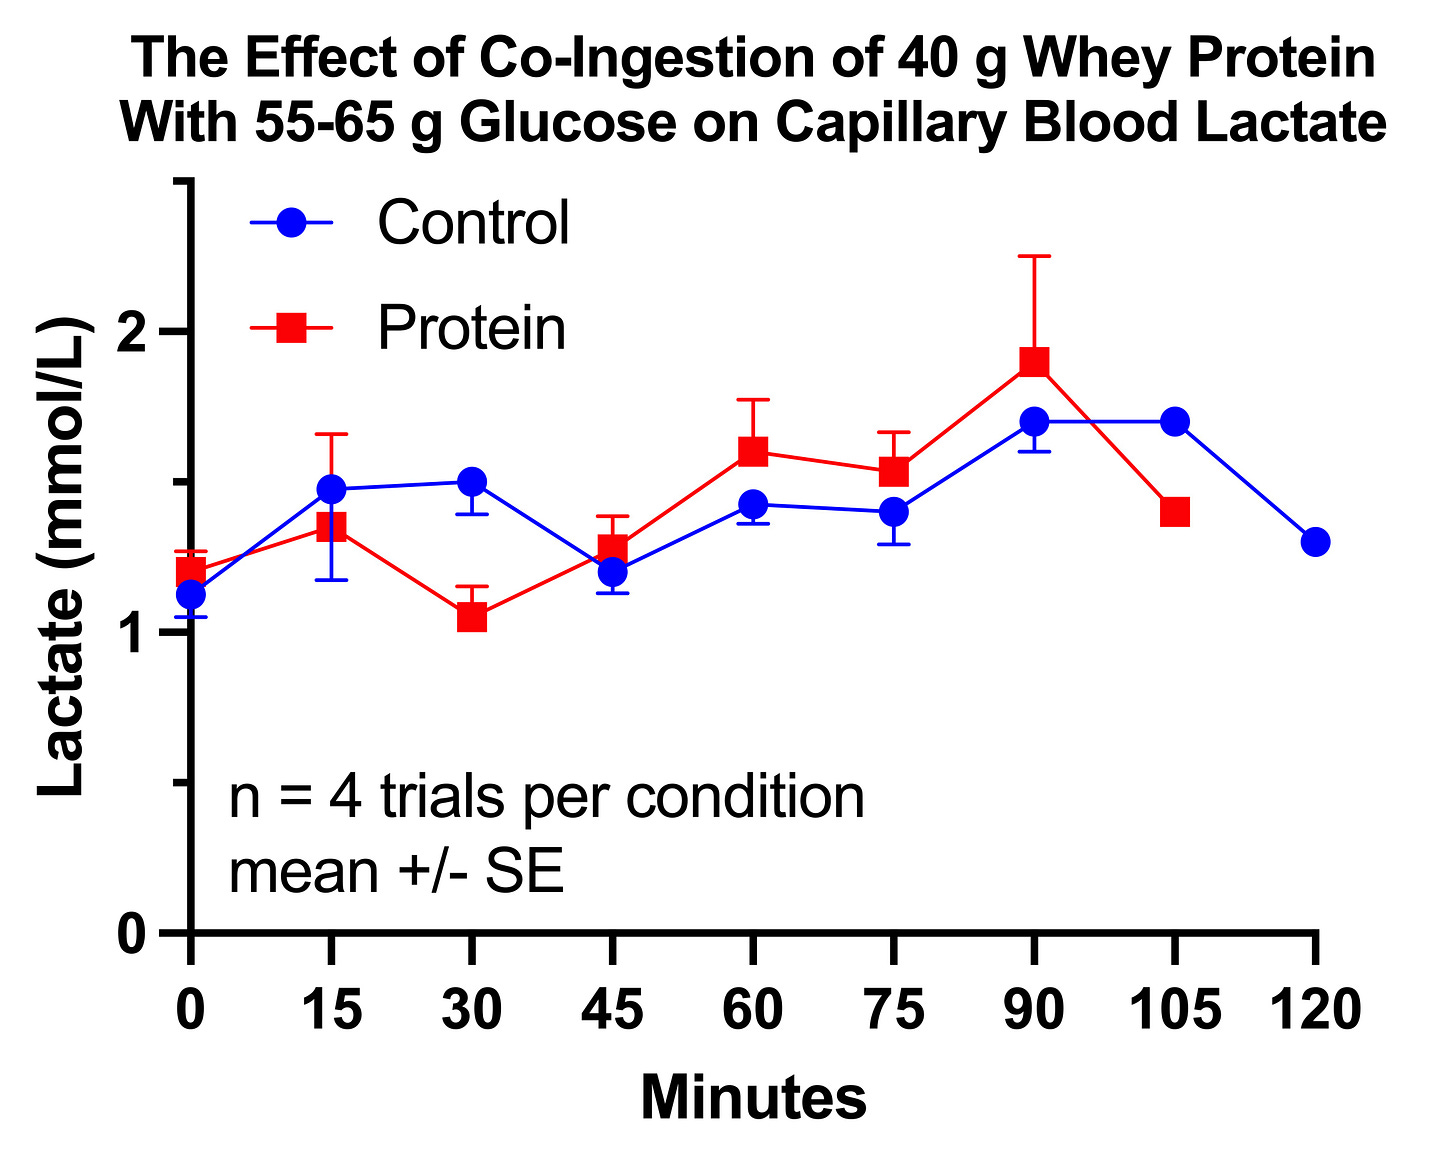


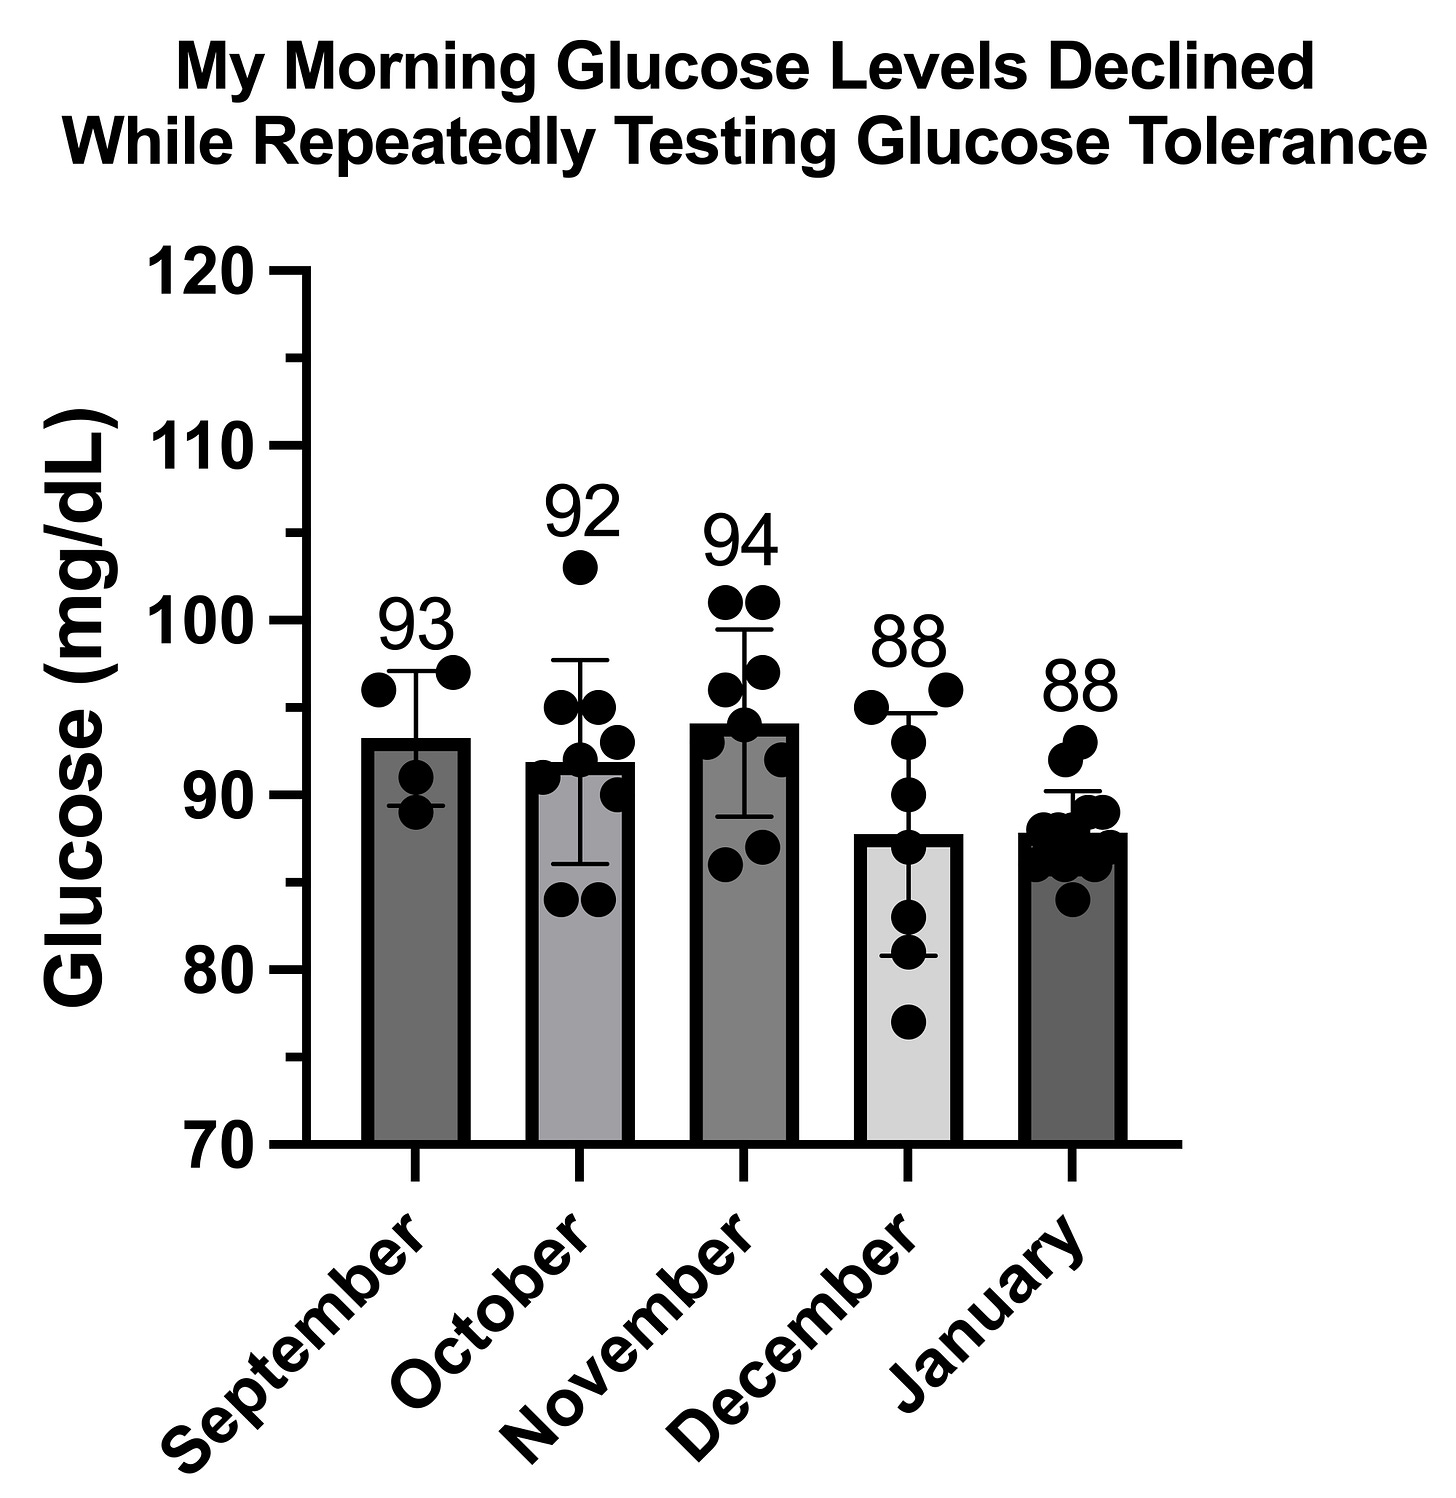
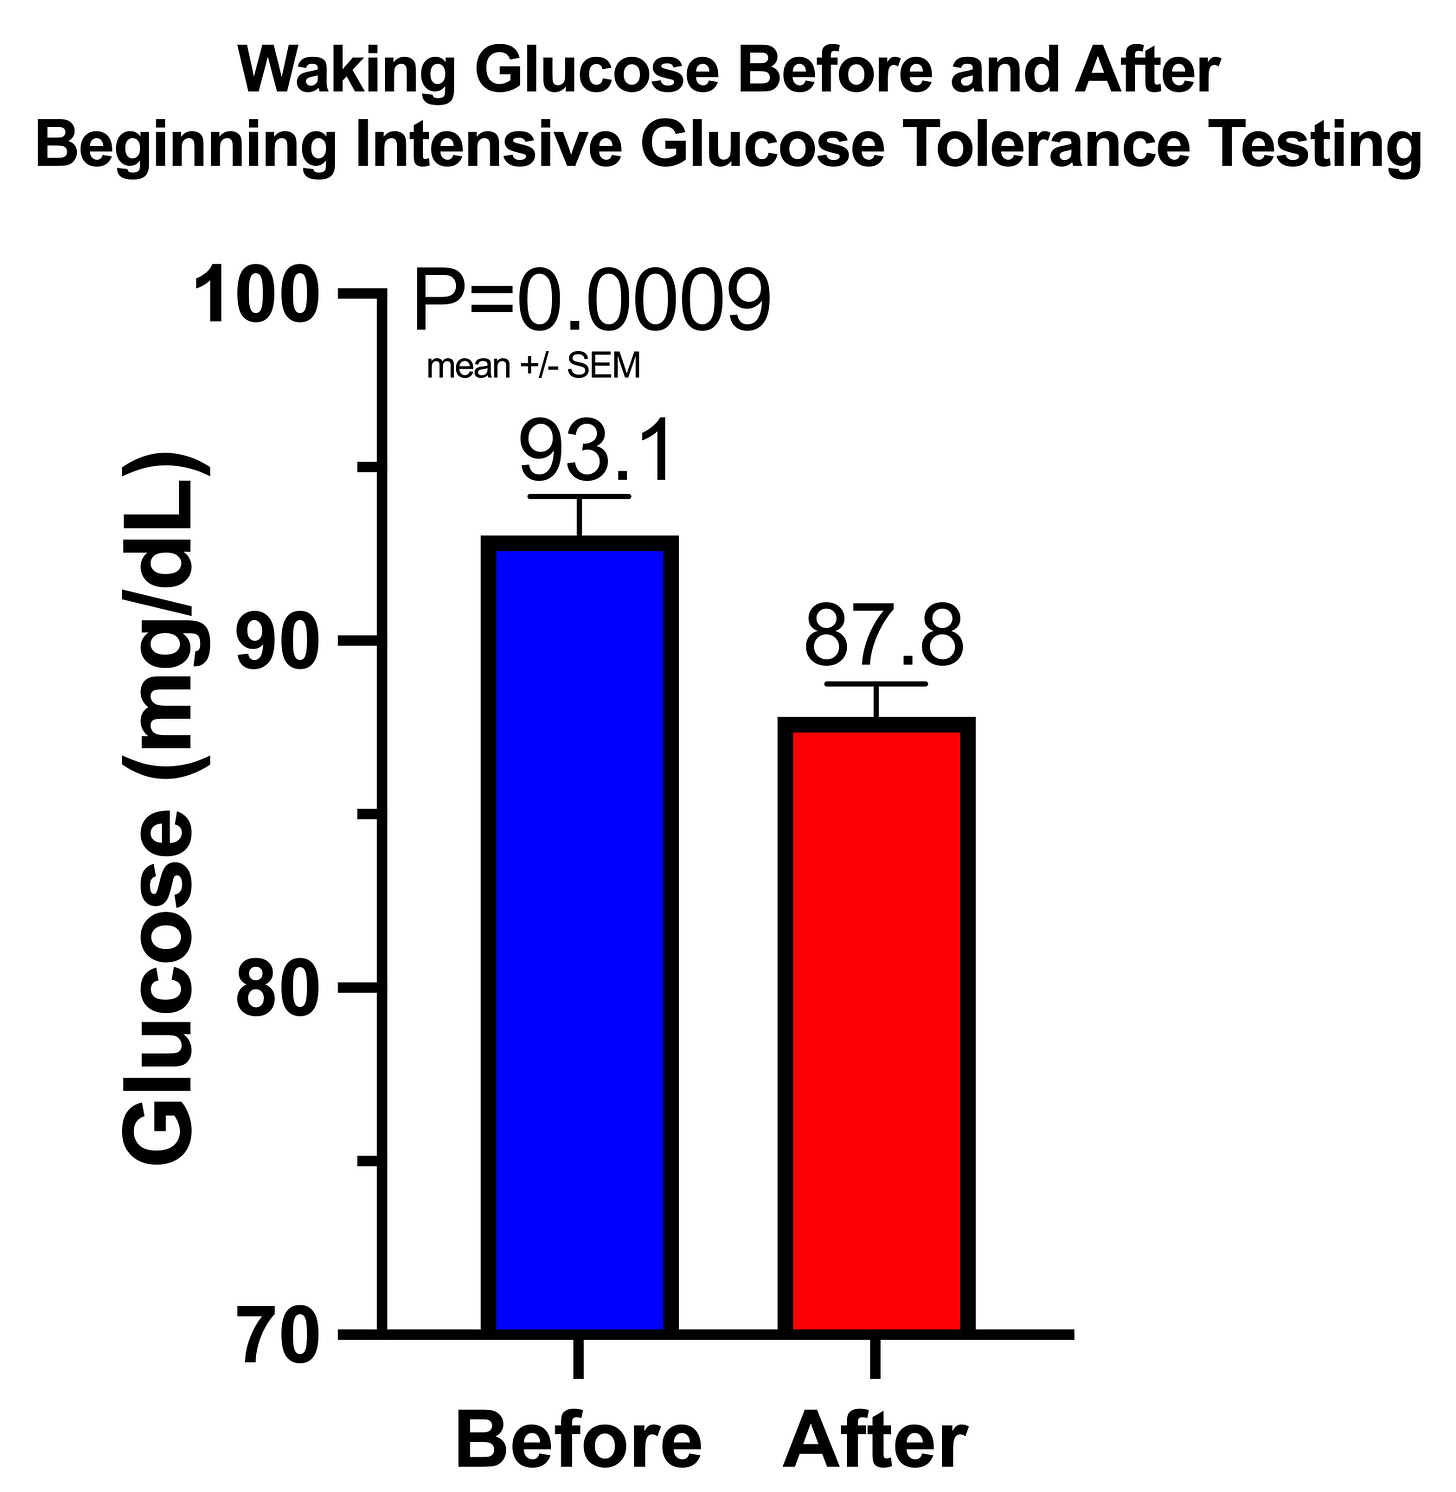
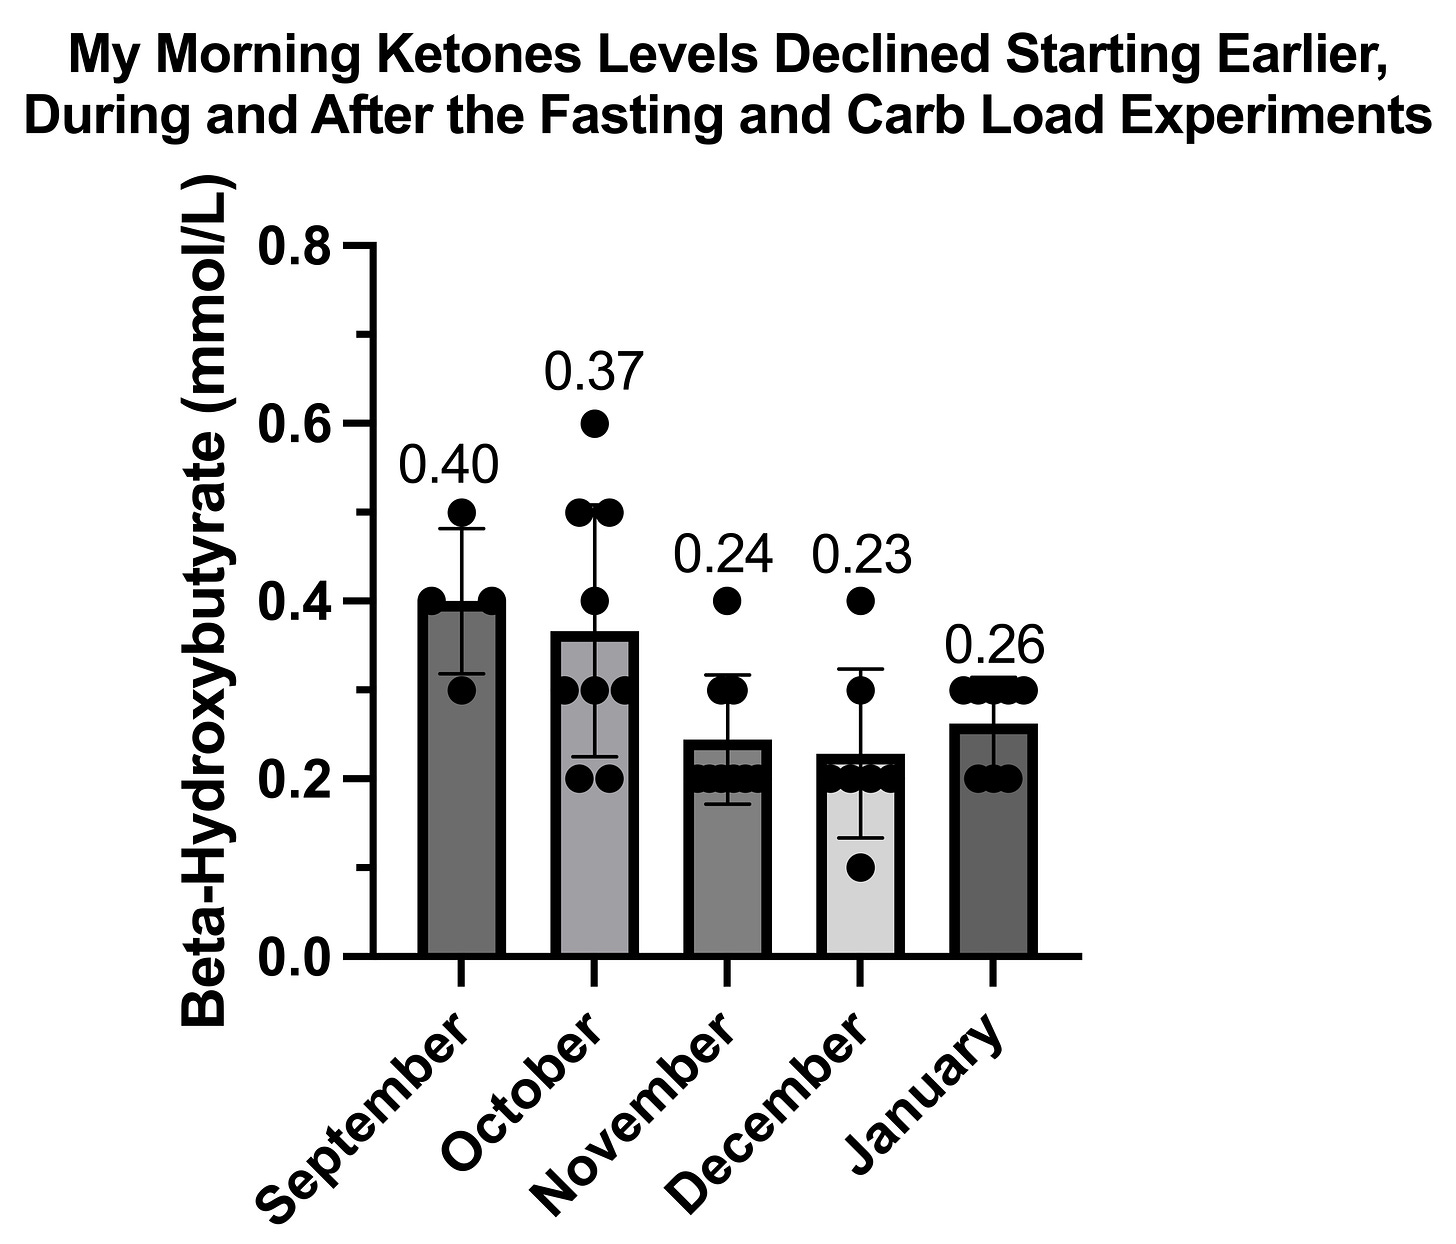

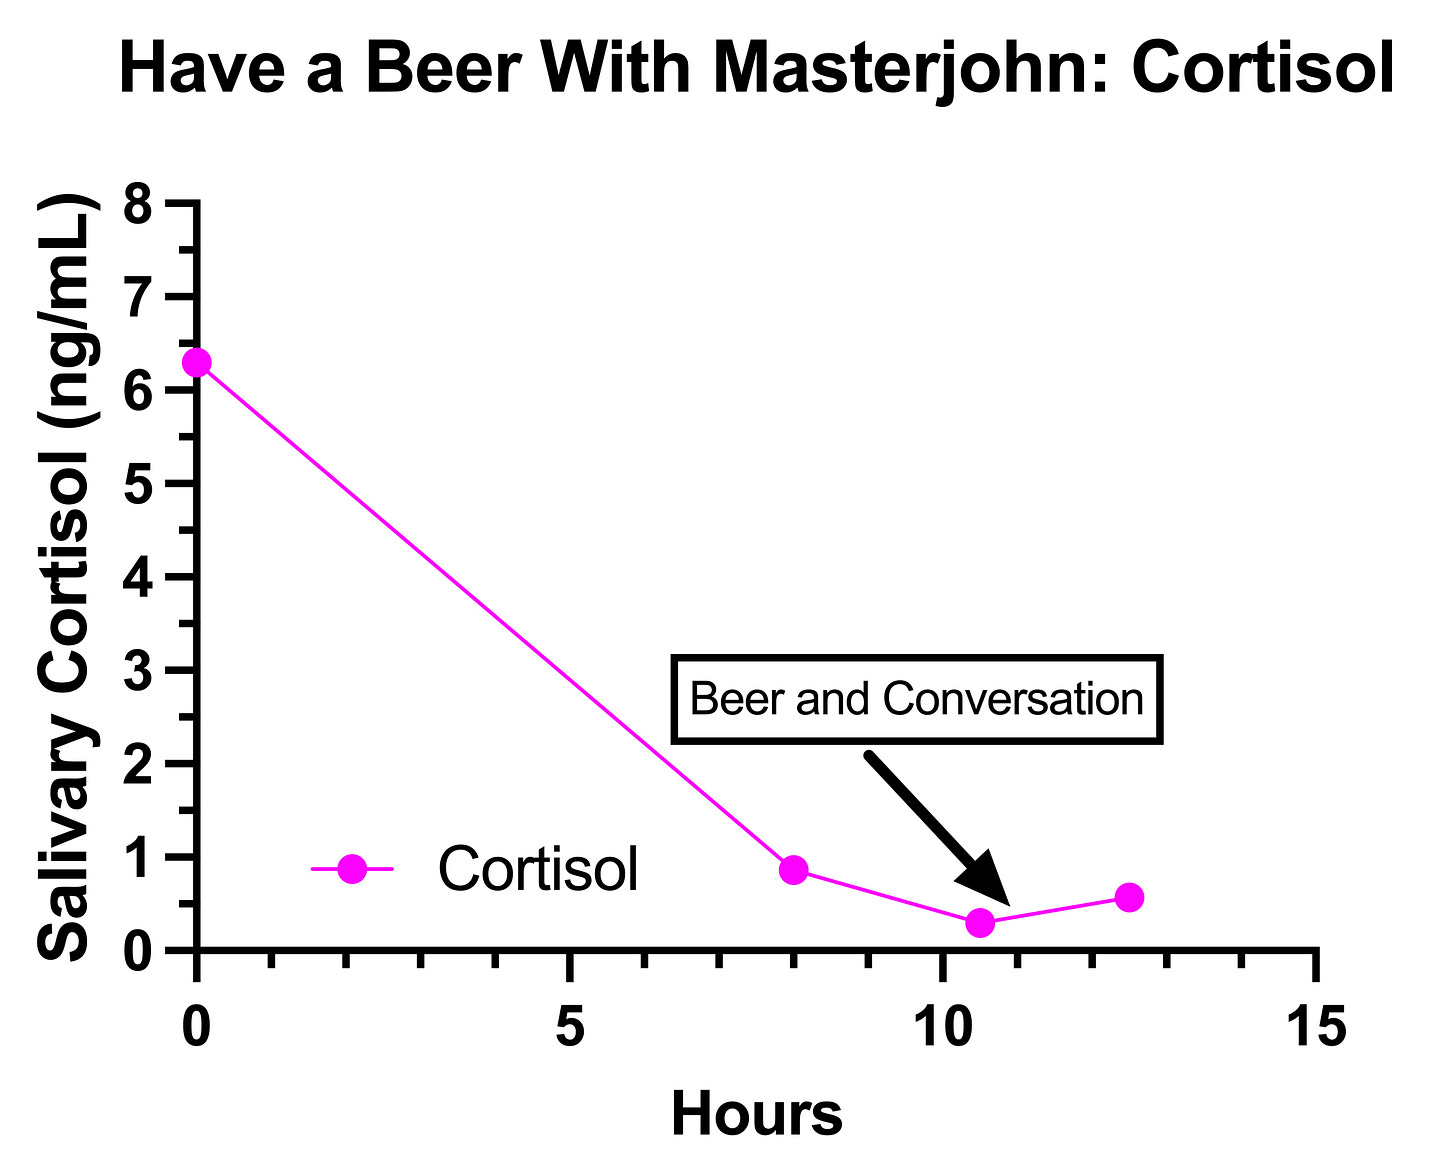


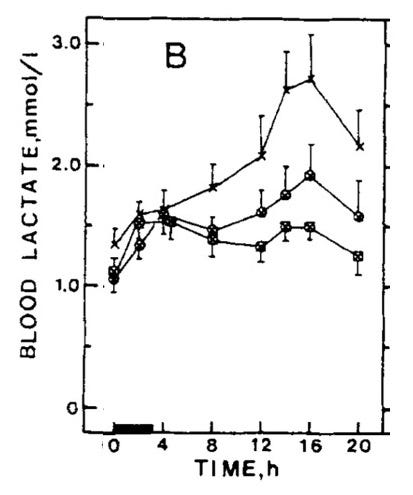
UPDATE LOG
I sent this out, and when I got home I tested the beer for lactate. So, I rewrote this section:
==========
I was a drinking an IPA, which is not sour, so should not have more than trace lactate. The lactate meter (NovaBiomedical Lactate Plus) does not clearly state its isomeric specificity, but it should be isomer-specific and not detect bacterial lactate. Bacterial lactate is D-lactate. While D-lactate is made by humans as a detoxification product of methylglyoxal, circulating lactate is mostly L-lactate, which is what is made from glycolysis.
Therefore, this is almost certainly an effect of the alcohol.
===========
It now reads like this:
=========
I was a drinking an IPA, which is not sour, so should not have more than trace lactate. The lactate meter (NovaBiomedical Lactate Plus) does not clearly state its isomeric specificity, so it is not clear if it would pick up bacterial lactate.
I tested my beer with the lactate meter (same beer as I used on February 3) and it clocked in at 0.6 mmol/L. The average human has almost 5 liters of blood, 3 liters of which is plasma. 18 ounces of beer is 0.53 liters, which means there were 0.32 millimoles of “lactate” in the beer I drank. If 100% of that entered my bloodstream at once, and was not taken up by any cells or metabolized in any way — which is completely implausible — it would be distributed through 3 liters of plasma and would raise my plasma “lactate” by 0.11 mmol/L.
The beer rose my lactate 26.3 times more than this.
Therefore, this is definitely not an effect of any “lactate” in the beer and is almost certainly an an effect of the alcohol.
========
Is there any chance you are also manganese deficient as it’s also a cofactor for pyruvate carboxylase? Biotin has been helping me tolerate fat better and has given increased energy but there is still something missing as I just can’t build muscle. I have been working very part time at a not too physically demanding job and have developed myofascial pain syndrome behind my right shoulder blade from repetitive motion. The muscle pain is so intense at times that I can’t sleep. The only thing that stops it is ridiculously high doses of vitamin C 5-10 000 mg a day. Vitamin C is also involved in fat metabolism. I could never take vitamin C before because I would immediately have symptoms of copper deficiency. This is no longer the case since doing the high dose vitamin A. But something is still off because my skin and hair become very dry when using the vitamin C and fatty acids don’t seem to be the solution. Anyways, I’m glad to be using vitamin C for the pain instead of opiates. I will keep following your journey since although there are differences there is also sometimes some overlap. I appreciate your courage and interest in experimenting.