
How to Optimize Anything (Scientifically Proven)
Use this approach whenever you aren't already getting the results you want.

Not everyone has to optimize.
If you are in an emergency, you might need to throw the kitchen sink at the problem until you have some relief, and you may be necessarily in the care of someone else.
If you are suffering from a debilitating problem, you may feel the need to throw the kitchen sink at it and may not have the mental bandwidth to optimize.
On the other end of the spectrum, when you’re getting the best results you could ever dream of, the rule that applies is “if it ain’t broke don’t fix it.”
When you aren’t in the midst of an emergency and still want to improve something about your health, the first thing you should do is see if you can truly check off all the boxes in What Everyone Should Be Doing For Their Health. If fixing some low-hanging fruit you are missing gets you what you want, you can now revert back to “if it ain’t broke don’t fix it.”
Perhaps you are skeptical that one or two of those boxes is necessary. You can actually test whether checking them off helps you with the strategy described in this optimization guide.
One reason to optimize would be that you are a data junky and love optimizing everything. Or, you’re a mad scientist and love running experiments on yourself. If that’s you, dive into this strategy with with your whole heart. You’re going to have lots of fun.
For most people, the reason to optimize is that you are doing what you know to be best practice, but there are still areas where you want to improve.
Maybe your sleep could be better. Or your energy levels. Or you want to gain ten pounds of muscle. Or you’re grappling with a biomarker you are trying to optimize for longevity.
Whatever it is, this is the guide to optimizing anything. We focus on health, but the basic principles apply to everything that could be optimized.
The key to optimizing optimally is to apply the scientific method to yourself, while artfully balancing rigor and practicality.
This is educational in nature and not medical or dietetic advice. See terms for additional and more complete disclaimers.
Download the Ultimate Guide to Optimizing Anything
The Ultimate Guide to Optimizing Anything is a streamlined 8-page quick guide. Click here to download it.
Print This Article out and Read It In Natural Lighting
This full article is 33 pages long. You can print it out here to read it in natural lighting:
This Guide Isn’t About WHAT To Optimize
This guide provides an overarching framework to apply to anything you want to optimize.
If you want to start reading about what you should optimize, start with my guide to the top three tests to run for your health:
3 Tests to Transform Your Health (and Your Lifespan)

If you are already doing What Everyone Should Be Doing For Their Health and there are still things you want to improve about your current health or that you want to optimize to protect your future health and longevity, it may be time to do some lab testing beyond whatever your doctor orders for you in your checkups.
Otherwise, read on about optimization!
Decide Whether Optimization is the Right Strategy
You can use this decision-tree chart to help you figure out if optimization is the right strategy for you at this time.
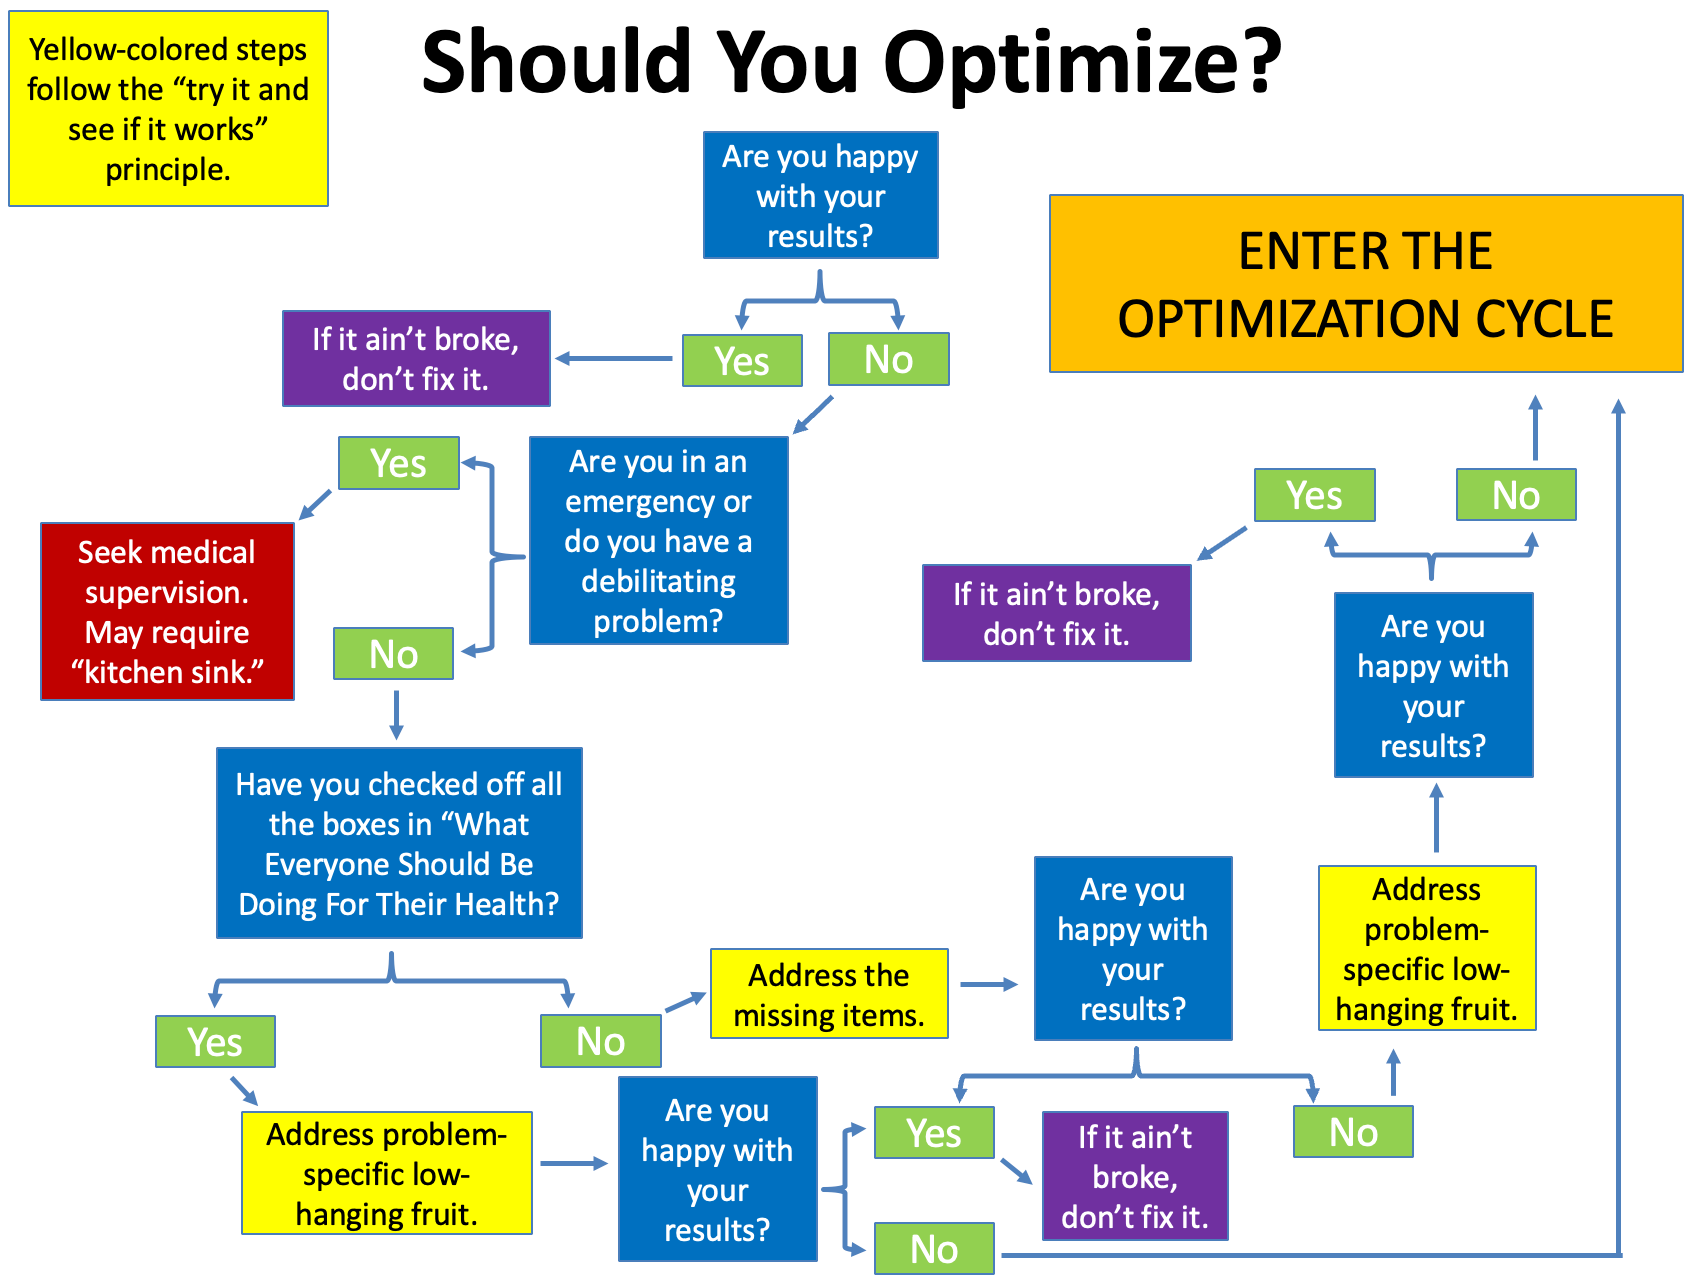
“If it ain’t broke, don’t fix it,” “throw the kitchen sink at it,” and “try it and see if it works” are all important strategies to use outside of optimization.
If you are happy with your results on your current regimen, there is no reason to alter it.
If not, you might need to throw the kitchen sink at the problem or simply try something and see if it works. Throwing the kitchen sink at something makes a mess that is impossible to decipher on the back end, so it only makes sense in an emergency or a completely debilitating situation, and both of those things call for expert guidance or expert care. Low-hanging fruit could either be of the general kind, as outlined in What Everyone Should Be Doing For Their Health, or of the problem-specific kind.
There are many problems and there is no end to the number of problem-specific things you could simply try and see if they work, but an example would be that if you are unhappy with the amount of muscle in your chest and you don’t do many pushing exercises, adding some pushups or bench press sets might help you out a lot. Whether something is truly “low-hanging fruit” can often be judged in retrospect on the basis of whether “try something and see if it works” actually worked. If it is well known, though, that almost everyone else who tries a particular strategy gets success with it even if they don’t perform rigorous data tracking, that is a very good sign that “try it and see if it works” could work for you.
If you’ve gotten to this point and still want better results, now is the time to enter the optimization cycle.
Decide What to Optimize
Define clearly what you are going to optimize.
This is the dependent variable in the scientific experiment you are performing on yourself.
Measure What Matters
As once said by the late, great founder of modern management theory Peter Drucker, “what gets measured gets managed.”
Don’t get lost in proxy markers. If you are trying to optimize feeling rested when you wake up, you must rate yourself on how rested you feel when you wake up. You cannot substitute hours slept because it is easier to measure. If you are trying to increase your libido, you cannot measure your testosterone as a substitute. Be very clear about what you are optimizing, and measure it directly.
This doesn’t mean you don’t track total hours slept or testosterone. Those are quite possibly causes of how rested you feel when you wake up or how strong your libido is. The point is simply to always measure the thing you care most about.
If what you are optimizing is already in numeric form — for example, number of hours slept or fasting glucose — you don’t need to convert it in any way.
If what you are optimizing is not yet in numeric form, you need to convert it into a number. For example, each morning rate yourself on a scale of 1 to 5 on how rested you feel.
You should use a scale of 1 to 5 instead of 1 to 10 because you want to have clear definitions of each score, and it is a lot harder to come up with 10 clear definitions than 5.
You can self-rate up to five things. More becomes too cumbersome.
You can focus on optimizing one or two of them at a time.
The other three or four can be leading candidates to be optimized in the future, and if you can see wanting to optimize them in the next six months, you should start rating them now. Or, if you’ve already optimized them, you should track them to make sure they stay optimized.
If you have other things being tracked automatically and effortlessly, you can have as many as you want. For example, if you have a sleep tracking device recording your REM, deep sleep, and resting heart rate, and HRV, and it all gets tracked in an app, it doesn’t take any mental bandwidth for you to track it and there’s no need to translate it into your spreadsheet unless it is a current, past, or leading candidate for a future optimization target.
Pre-specify the definitions of your numerical self-ratings now. Spend twenty minutes thinking it out clearly. Define what a 1, 2, 3, 4, and 5 mean. Glance at this every time you rate yourself until you have it thoroughly memorized and check back with it once a week after that to make sure your “memorized” version doesn’t drift. This holds you to a consistent rating pattern and prevents your perception from drifting along with your expectations over time. It also makes it so that you never have to think too hard about how to rate yourself ever again. Just look at the definitions. If you’re not sure whether you’re a 3 or 4 today, you’re a 3.5. Done. Not having to think too hard or too long about it makes it a sustainable practice.
You can borrow someone else’s definitions from a questionnaire. But should you? Generally, no. Do this if you feel at a total loss about how to rate yourself, but your definitions are best tailored to what is relevant to your own health goals. Some institutions’s definition of fatigue will never be as relevant to you as your own definition of fatigue, because you are the only person who is intimately familiar with how your own fatigue manifests and feels.
Make your definitions so that you expect to have a monthly average of 3 when you first start tracking. Make them so you expect to see at least a few 2s and at least a few 4s over the course any given month, but you would have to get substantially worse to see a 1 or substantially better to see a 5. You can also set it so that 5 is horrible and 1 is great, whatever is more intuitive to you.
Rate yourself every day. Either at the beginning or the end of the day. Make a ritual out of it. It should take one or two minutes.
Why should you bother with these numerical self-ratings? Five reasons:
It massively increases precision. Sometimes things change very slowly over time. If your average daily energy level each week is going from 3 to 3.1 to 3.2, it’s probably noisy enough that you can’t even tell the difference. But when you look at your average weekly data you will indeed be able to see it.
It prevents expectation drift. If you get healthier over time, you will expect to be healthier and you will fail to be impressed by your health. If you get less healthy, the reverse will happen. When your criteria are pre-specified and easy to look at, you will keep your ratings consistent and allow you to make objective comparisons.
It allows you to run averages. If you can’t calculate a weekly or monthly average, you are left with a vague sense that “I seem to get startled too often but it’s always going up and down.” But if you’re able to calculate that the weekly average went down from 4.0 to 3.7, you know you’re on to something that seems to be reducing your startle reflex.
It allows you to visualize your data. Simply creating a line chart can allow you to see an upward or downward drift in what you’re measuring very easily where you’d probably miss it going on your general sense alone. Or if you test something in each of several conditions, you can make a bar chart that allows you to quickly get a sense of whether your variable is having an effect.
It allows you to make statistical comparisons. There are easily available, easy-to-use online statistical calculators where you can copy and paste your data to see if it’s statistically significant. You can do this with numbers, but you can’t do this with anything else.
Make Your Measurements Every Day
Whatever you are rating should be rated every single day.
Anything you can measure at home must be measured every single day.
I have seen some people advise their clients to weigh themselves weekly so they don’t get confused and discouraged by random daily fluctuations in their weight. This is terrible advice. All it does is make your data seven times less useful.
If you take this approach, you will not know if your weight is going up or down at all for three to four weeks, and it will take you three months to know how fast or slow you are using weight.
If you have come to the point where you have decided that optimization is right for you, you need to train yourself to take the data daily, but focus on the averages.
If you are an expert optimizer, you might play around with single-day experiments, but in general you should ignore single-day data and focus on averages over time.
Never Second-Guess Your Data
I have seen many people take a glucose measurement. It’s too high! They take another. It went down. Oh good, it wasn’t as high as the first number said it was.
You cannot do this. Accept your data as-is.
You must always pre-specify your approach and then stick to it.
Why? Because violating what you have pre-specified introduces bias. If you take a finger prick glucose measurement and it is 99, and then because it is higher than you like you take another one and it comes in at 94, you have turned an unbiased measurement into a biased one.
The bias is this: you never took a second measurement because you liked it too much or it was too normal; you only took a second measurement when you didn’t like the first. That bias will lead you to overestimate how normal your measurements are and underestimate how abnormal they are because you are only second-guessing the abnormal ones.
If you suspect you have a problem with your data collection instrument, the solution to this is to perform a separate validation experiment with calibration fluids or with multiple pricks of different fingers or comparisons to ear lobe data or whatever you want to test. It is not to second-guess and repeat just the measurements you didn’t like.
I have also seen some people decide to do three measurements and take the average. While there is nothing wrong with doing this, you have to realize that if you are optimizing something you are going to have to take a lot more than three measurements. You may well increase your precision by taking the average of three measurements, but it may not be worth your time when you are going to have a larger number of measurements across time to take the average of. Regardless, if you do take the average of three measurements, you have to do it every day, or in a pattern that you have pre-specified, not just on days where you don’t like the first measurement.
Measure What Matters: Example
As an example, I track my energy at the end of each workday.
I organize my tracking to be part of my workday. On rest days, I rest from tracking. As such, my definitions are centered around the interaction between my physical fitness and my work productivity.
My ratings assume that I was able to keep up with my workout volume, but this part is circular, because I design my workout volume around what I can tolerate without experiencing a reduction in my work productivity.
I rate myself at the end of each day.
Here are my pre-specified definitions:
1 — I struggled to find the motivation to work.
2 — I got a solid six to ten hours of work in, but much of it was spent lying down.
3 — I got a solid six to ten hours of work in, and all of it was upright, but not necessarily active.
4 — I got a solid six to ten hours of work in, and at least 2-3 hours of it was spent in activity. For example, I worked while walking at 1.4 miles per hour on my treadmill, or in an active lunge with a straight-side glute contraction and a flexed-side hamstring contraction, or in a half lotus (which is a serious hip stretch for me), or in some other position.
5 — I got a solid six to ten hours of work in, and nearly all of it was spent in activity, and two to three hours of it were spent in double-activity. An example of double activity would be walking at 1.4 miles per hour on my treadmill while also doing a core contraction and practicing breathing into my upper back or doing a single side stretch of my shoulder, arm and fingers while the other hand controls my scrolling during reading.
My experience is that if my energy level is abundant, I can do many things with my body with plenty left over for my mind. If my energy level is scarce, doing any type of activity is extremely distracting to my mind. So, I prioritize putting myself in the physical position that allows my cognitive work to get done, and I rate my energy by how conservative I had to be or liberal I was able to be with my physical activity while getting that cognitive work done.
You may have a very different work style or a very different level of energy, so you might pick a totally different set of definitions.
The point is to pre-specify the definitions that are relevant to you, write them out clearly, and hold yourself to them.
How to Organize Your Data
Make a spreadsheet in Google Sheets, Excel, or a suitable alternative.
Each day is a row. Make a column for each measurement, and label the column appropriately. Freeze the top row so that the labels are always visible even if you have many rows of data.
Put the definitions for your self-rated tracking items in the top row so that they are easily accessed every time you rate yourself. You can either hide them in the column header of that item so that you view them by double clicking, or you can put them off to the right side so that you can scroll horizontally to see them.
In this example, the width of “Energy” is adjusted so that you can only see the column title without double clicking. Once you double click, it opens up the definition. This was made simply by putting the definition right after the column title but not selecting any text wrapping and adjusting the column width so that only the label could be seen.
In this example, by contrast, I put the definition of energy on the right-hand side, wrapped the text, and widened the column enough for it to appear in paragraph form.
Either of these are fine and you could in fact combine them if you wanted to. The point is that you need the definitions very precise, to the point, and easy to check so that you can hold yourself to them over time.
Major protocol changes, such as changing the dose of something or adding something, should be added intermittently in their own column.
Your protocol changes are the independent variables of the scientific experiment you are performing on yourself.
You will likely want a “notes” column at the end that serves as a journal for anything notable that doesn’t fit in another column. However, you have to be conscious that if you write a lot in the notes section, you aren’t going to read it very often.
—> Anything important as an outcome should be a number, not a note.
—> Anything important as a protocol change should be six to seven words max, and should be infrequently noted because you shouldn’t be changing your protocol every day.
For example, “increased creatine from 3g to 4g” might be in the Protocol Changes column, and two weeks later you might write “increased creatine from 4g to 5g.” Or you could simply call them “Creatine 3g,” “Creatine 4g” and “Creatine 5g.” You can then compare, say, your average sleep on 3 grams versus 4 grams versus 5 grams in about 30 seconds, but you could never interpret all your daily notes in 30 seconds.
The main purpose of the notes is to look through or keyword search in the future if you ever get stuck on an interpretation, or if you fundamentally change how you view something you had been recording in your notes and need to collect all the instances you mentioned it. Or you can add what you were thinking that made you change your protocol in case you forget why you did something. You might also list notable confounders in this section so that if your primary interpretation of something doesn’t pan out you can go back and look at the confounders to see if they help reveal a secondary interpretation.
The main point is this: take the notes, but consider them extra, not something constituting your primary data to analyze.
The Ultimate Optimization Spreadsheet
Click below to download the Ultimate Optimization Spreadsheet:
Do not open it in Excel or any other desktop program. Immediately drag and drop it into Google Drive and double click to open it as a Google Sheet.
Otherwise, features will be lost.
Make the following edits:
Change self-rated and extracted variable names to reflect the variables you are measuring.
For self-rated variables, replace each one’s name both in its data column as well as in its definition cell in the upper right, then fill in your succinct and precise definitions for 1, 2, 3, 4, and 5 for each of them.
Click on the top chart. Click … in the upper right corner, edit chart. Then click “include hidden/filtered data.” Keep the chart editor open and do this for the rest of the charts. It will now only require you to click once on the chart and then click once on “include hidden/filtered data” and keep doing this until you do it for the eighth and final chart.
Now all you have to do is enter your data.
Hidden columns will automatically calculate and graph your daily data and the 3-day, 7-day, and 30-day rolling averages, and your protocol averages will be assembled into a table on the right-hand side based on when you enter protocol changes into column A.
Here is a video to help orient you to it:
At 18:43, it explains how to add extra variables and keep the features if you need to track more than eight.
Characterizing Your Background Data
Somewhere you should have your entire regimen characterized. For example, your diet and supplements can be tracked in Cronometer and your workout could be tracked in an app like Jefit or, if you work with a trainer, Everfit.
If you run lab data that is impossible to run daily, such as the data that comes with an annual checkup or your own self-organized quarterly lab testing, this can live in the lab portal. For example, Quest now does a great job keeping track of your results and formatting them as change-over-time line graphs.
If you are testing dietary components, you really should consider Cronometer tracking mandatory. If you don’t want to put in the time weighing out your food and tracking it meticulously each day, you should just sit down for ten minutes and log what you consider to be your likely intake of foods over the course of a month into one single day, and generate the nutrient report for the entire month, giving you at least a general idea of what your micronutrient intakes average to over the course of a month.
Your optimization spreadsheet is for analyzing your primary outcome data (your dependent variables and your primary protocol changes (your independent variables) and does not need to have the totality of your regimen, as long as the totality of your regimen is easily accessible in one or several other places, you do not need to track it all in your spreadsheet.
However, it should be available in such a way as to be able to easily characterize it for any time period that is relevant, and to be able to extract data if you decide they are relevant enough to include some portion of them in your spreadsheet for ease of comparison or visualization.
If you are a data junky, feel free to extract all of that background info into one giant spreadsheet, but this should not be in your optimization sheet. It should be a different file altogether or it should be its own tab within your health spreadsheet, with the optimization sheet being the main tab you use.
You should extract a variable from your background data into your primary spreadsheet if you believe it may be either a) an intermediary between your protocol and your outcome, or b) a confounder that complicates the interpretation of your protocol’s effects providing it also is a) variable enough that it is worth tracking daily and b) irregular enough that it doesn’t simply average out.
For example, say you are optimizing your sleep and are testing creatine. Your carb intake might not be part of your experiment, but it might vary quite a bit from day to day and you might become convinced its variability is influencing your sleep, acting as a confounder of the creatine. You may then want to be able to extract it from Cronometer into a column of your spreadsheet.
However, if you keep your carb intake constant enough that its influence is muted, there is no point in extracting it to your spreadsheet, and if its ups and downs are so regularly cyclical that they average out over the relevant timespan — for example, your protocol steps are at least one week long and your average daily carb intake is roughly the same from week to week — then there is also no point in extracting it.
Similarly, you could be testing whether black seed oil increases your energy, and you expect that it could do so by lowering your inflammation, shifting iron from storage into the synthesis of energy utilization pathways. In that case, you should extract your annual or quarterly iron measurements into your optimization sheet, and should strongly consider measuring them more frequently to help optimize your dose of black seed oil.
If you can keep your background variables more controlled, it will help you get quicker results in your experiments.
For example, I eat the same thing every day weighed out to the gram on my workdays, and I relax my diet on my rest days. This allows me to change one thing in my diet and clearly distinguish its effect since nothing else in my diet is varying.
You do not have to do this.
The solution to greater background variability is to collect more data. Since you are only a single person, the only way to collect more data is to run the experiment for a longer period of time, giving you more days to measure.
You should assess the extent of this background variability. For example, if you eat a rotation of foods and the rotation is fairly consistent, then your intake will average out over the period of your rotations. If you rotate seven different dinners across a week, your weekly average intakes will even out. If you are less deliberate but do not have infinite appetite for variation, you are probably averaging out at least on a monthly basis.
If your dietary variability is clearly adding noise to the variable you are tracking, simply extend your experimental trials so that they span the spectrum of variability. If your diet tends to repeat week after week, make your dietary interventions so that each trial lasts at least a week. If your diet tends to repeat month after month, make them last a month.
If you are optimizing something that is clearly influenced by your menstrual cycle, you are going to need each experimental trial to last through at least an entire menstrual cycle.
Decide What to Test
Having chosen what to optimize as an outcome and having set up your data tracking correctly, you now must choose what to test as an intervention. This could be one of the steps in any of my Protocols Series, or it could be something from ancestral traditions, something someone recommended, something that you found a scientific study supporting, or something you came up with yourself based on biochemical reasoning or intuition.
Make a very brief description of the intervention you are testing and include it in the “Protocol Changes” column of your sheet.
Make sure to also log it wherever you are keeping the full regimen of its category logged. For example, if it is a dietary or supplement strategy and you track your diet and supplements in Cronometer, make sure to also log the change in your Cronometer.
Test One Thing At a Time
If you test more than one thing at a time, you will not know which thing is responsible for any effect you observe.
Isolating your changes to one intentional change at a time does not automatically give you a robust ability to determine causation, but it does remove the major barriers to such a determination that are under your control.
As covered in the Background Data section, you will still have many confounders operating in the background. Your job is to carry out each trial long enough to let these confounders average out so that your signal rises above the background noise.
This does not mean you have to test one isolated nutrient at a time. Testing a multivitamin, a B complex, or an infinitely more complex whole food, is a completely valid test. However, you must make your inferences about the things you are testing. For example, adding pizza is testing “pizza,” not “carbs.” Adding a Thorne Basic 2/Day Multivitamin is adding that specific multivitamin, not just any multivitamin and certainly not one of its nutrients. The point is, you are not adding a multivitamin and adding pizza to increase your “carbs” and then trying to determine which one is causing the subsequent changes in your health that you observe.
If you add pizza and you hypothesize that its effects are due to the extra calcium in the cheese, and you want to be able to know if that is true, you can run subsequent trials for other forms of cheese providing the same amount of calcium, or for other food sources of calcium such as bone meal, or for isolated calcium supplements. You do not need to test these things, but if you want to be able to know it is “calcium” that produced the result, you will have test them to properly form that conclusion.
There are many synergies involved in nutrition. They are complex and require expertise to understand. This can be self-made expertise. It does not require a degree to understand, but it requires considerable study.
In my Protocols, I combine items into a single step when I believe their synergy outweighs the value of testing them separately.
If you do not have adequate expertise to judge what is synergistic and what is not, it is best to defer to whole foods, supplement formulations on the market, and expertise you are able to tap into through your network or online.
As a general rule, trying to increase a vitamin or mineral through food offers a major margin of safety against violating a principle of synergy that you could very easily violate with a supplement.
Moving very slowly through dose ranges as advocated below offers another margin of safety.
You can obtain another margin of safety simply by grouping nutrients together by class. You can expect that all nutrients have some potential synergy with each other, which makes a high-quality multivitamin one of the safest supplements to try. B vitamins all have intimate interactions, so a B complex is safer than an isolated B vitamin. The groupings in Testing Nutritional Status: The Ultimate Cheat Sheet can further help you see synergies to expect based on the overarching categories into which nutrients are placed.
Whatever your intervention is, no matter how simple or complex, define exactly what it is, make your inferences exactly about it, not some fanciful assumption about the broader thing it is meant to represent, and isolate your intentional changes to that one thing. Allow your trial to go on long enough to ensure all the things outside of your control in the background average out over time.
Slowly Titrate Your Dose to the Point of Maximum Benefit
You can expect everything in life to have a dose-response curve that looks something like this:
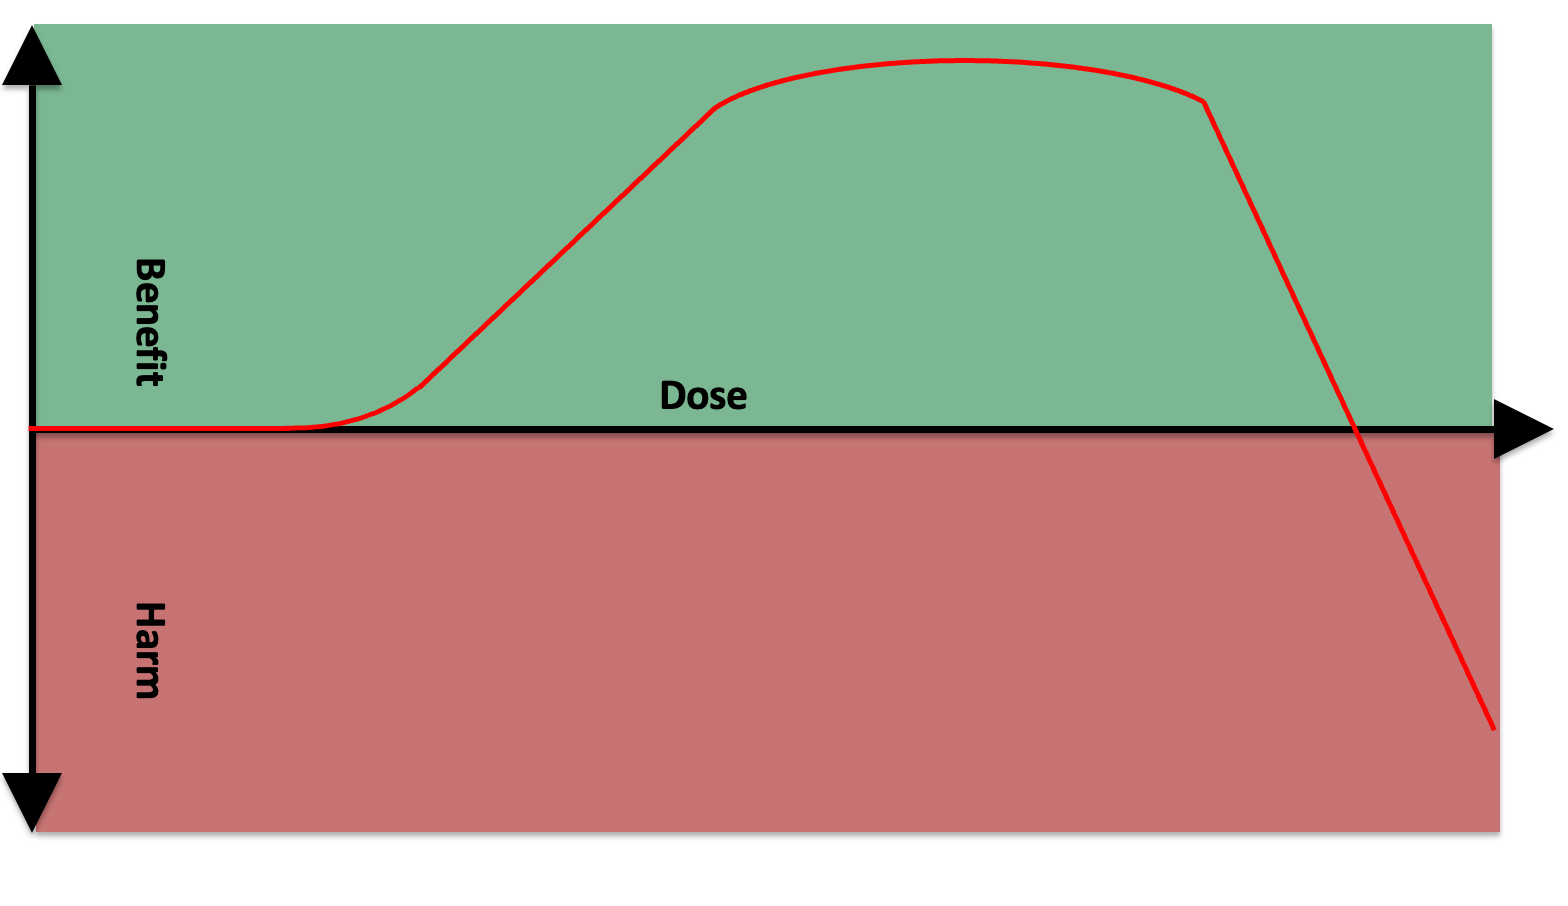
At a low enough dose, it is doing nothing.
Somewhere after that you have some sort of dose-response curve where a bigger dose gives you more benefit.
You then experience 1) diminishing returns, where an increase in dose still gives you more benefit but the slope becomes less steep, 2) a plateau, where increasing the dose does nothing, 3) a loss of the original benefit, and then 4) an adverse effect.
The curve can thus be broken into six major sections:
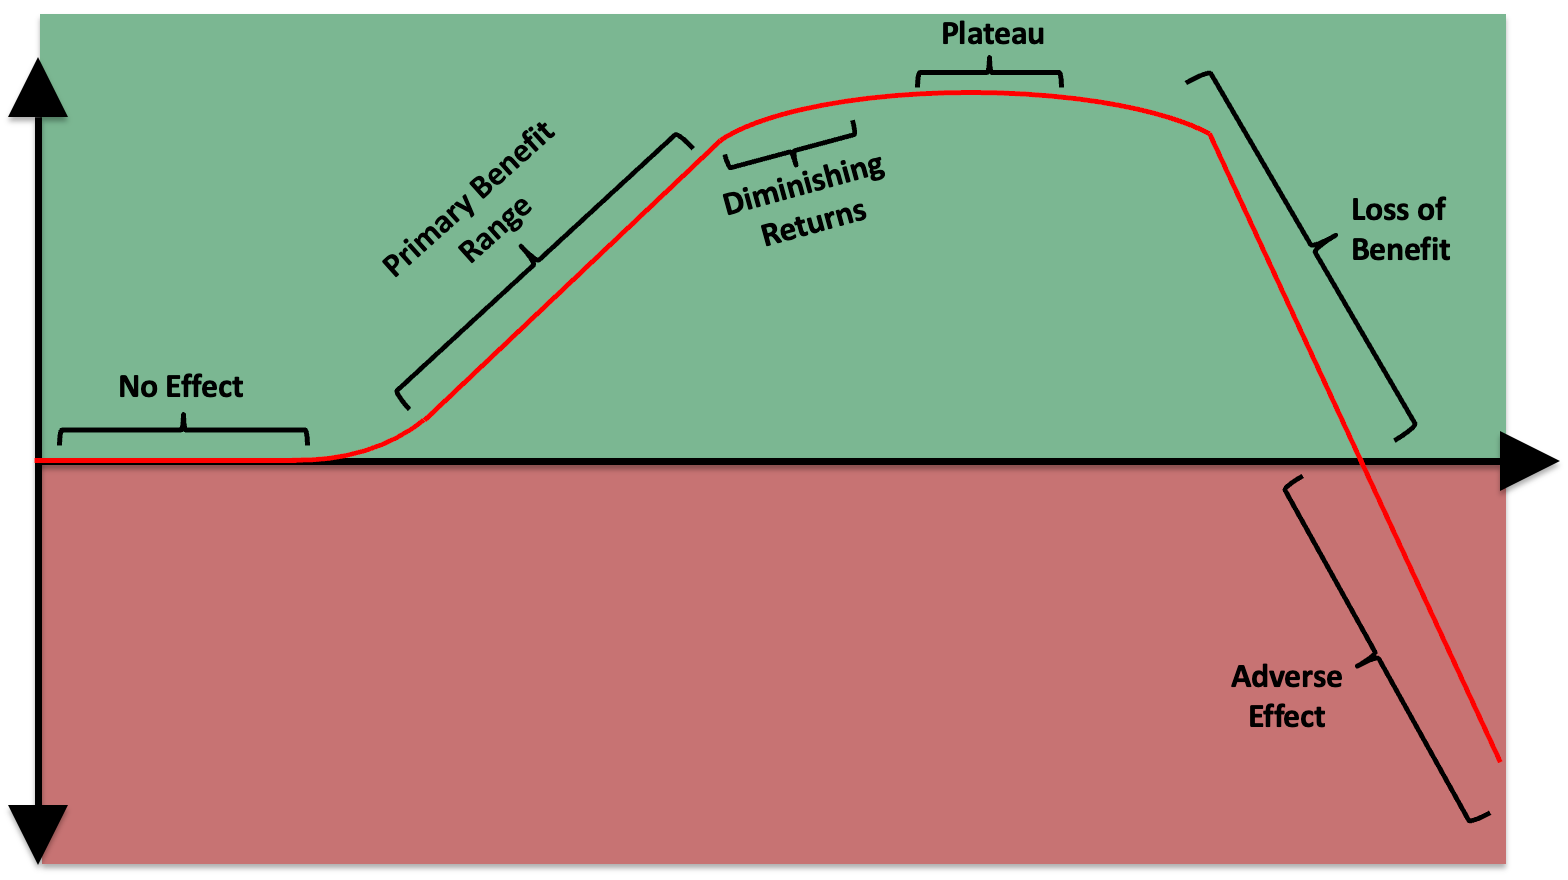
There may be things in life where we do not see the full curve play out, but this is probably because we lack experience of certain doses. For example, there might be some degree of lead exposure that is beneficial through the principle of hormesis — the concept that a little bit of something bad is good for you by stimulating your adaptive defenses — but this might be underneath the lowest possible exposure in the modern environment and therefore be irrelevant. Or, we might lack the willingness to study this due to the downside consequences of being wrong about the dose.
Nevertheless, we can assume that the general principles of this curve play out across all things, and the practical point is that they are going to play out for anything that we are actually going to test on ourselves.
This could apply to resistance training and hypertrophy. Not enough stimulus, no adaptation. Within some range, more sets, more muscle growth. Then, a marginal set does give you more muscle growth, but a lot less additional benefit than the previous number of sets gave you: diminishing returns. At some point you are overreaching and then overtraining and you are stressing your body out so much that you compromise its ability to grow or even wind up in a straight-up catabolic state.
This could apply to time management. You can spend so little effort analyzing your time management that you learn nothing. At some dose, you start learning how to manage your time more efficiently and have remaining bandwidth to execute on your new insights. At some greater dose you spent so much time analyzing how you spend your time that you had no time left to actually do anything.
It applies to everything.
With a vitamin that has a toxicity syndrome, such as vitamin B6, it is more obvious that at some dose you get into “harm.” What is less obvious is that any nutrient can ultimately cause imbalances if its dose gets too high. For example, if you pound fat-burning nutrients like B2, B5, and CoQ10, you could eventually wind up in a state where you are burning more fat than your body would otherwise deem appropriate and this might hurt your skin by draining its lipid content or hurt your glucose metabolism by constantly shoving fatty acids in the way of your carbohydrate oxidation pathways.
Many people say you want to use “the minimal effective dose.”
It depends how you interpret this phrase. It sounds on the surface like it would put you here:
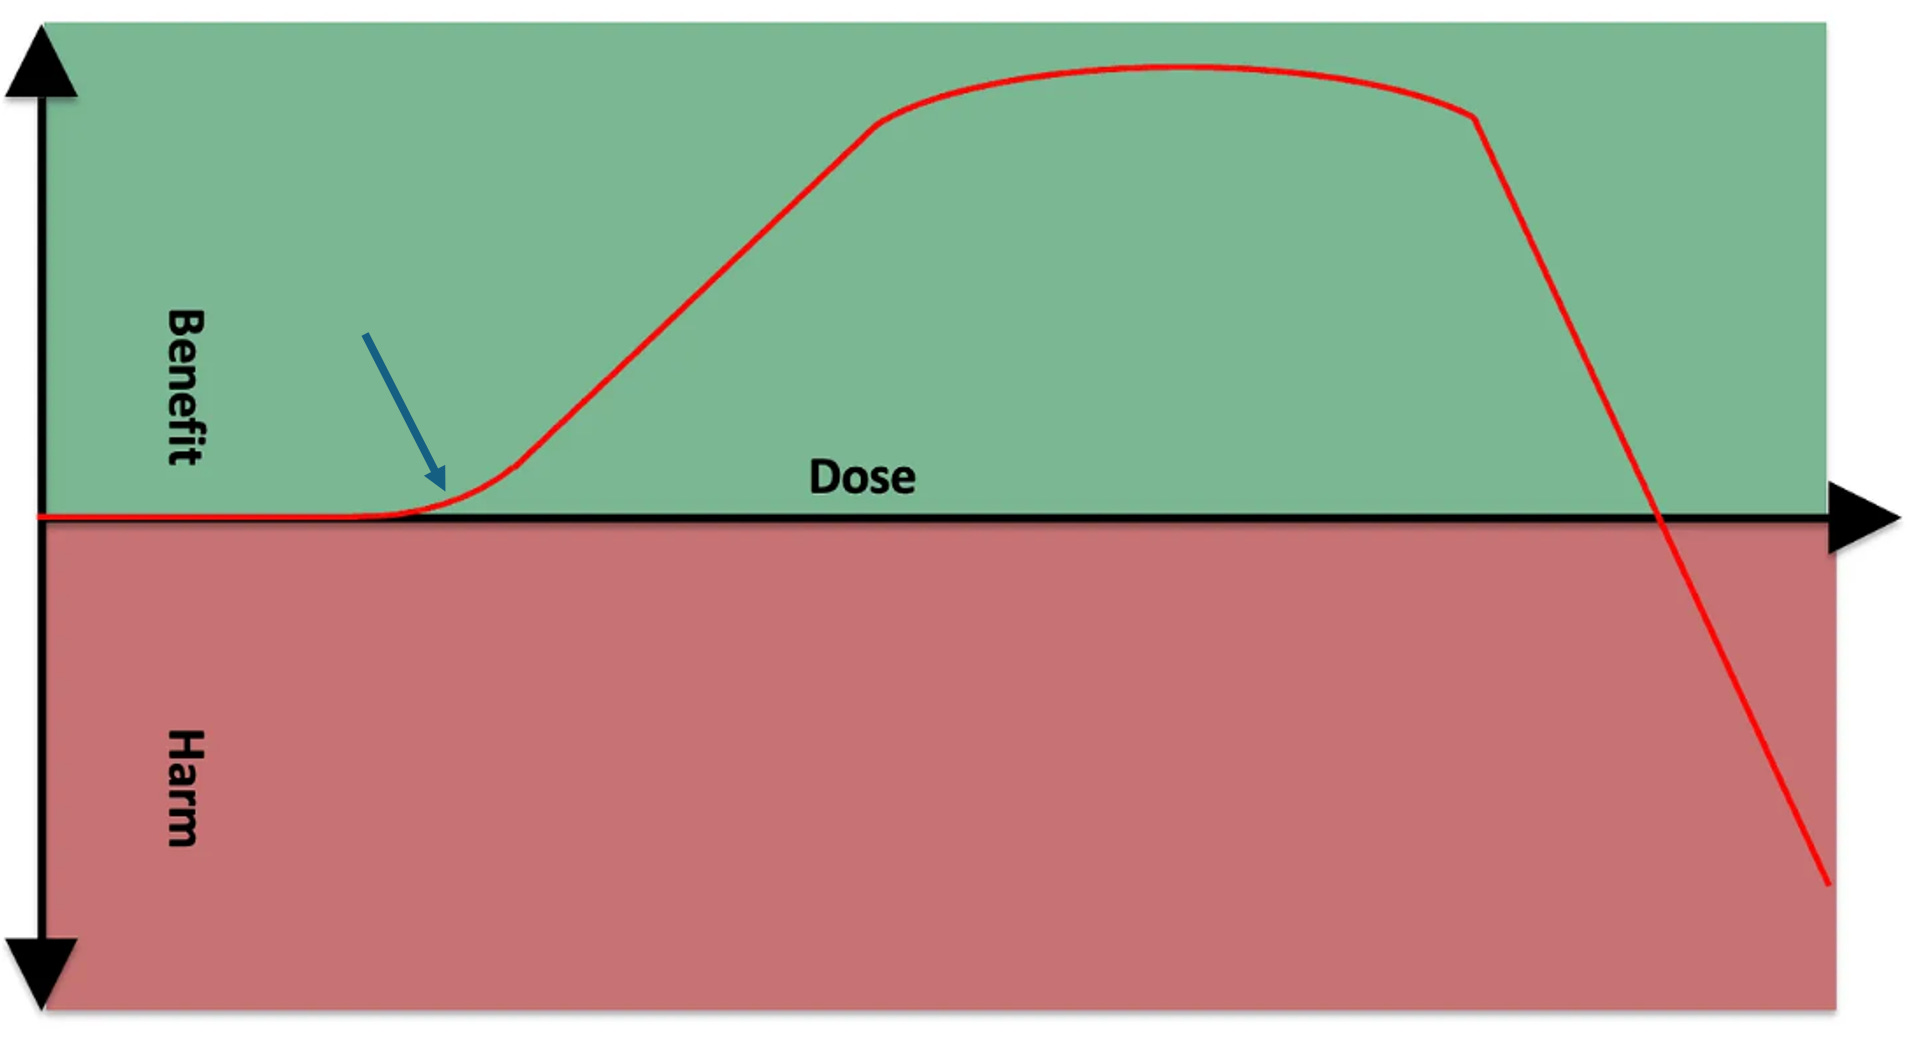
If you interpret this as “the minimal effective dose necessary to achieve the desired outcome,” then that would presumably put you at the beginning of the plateau point, since your desired outcome should be maximal benefit:
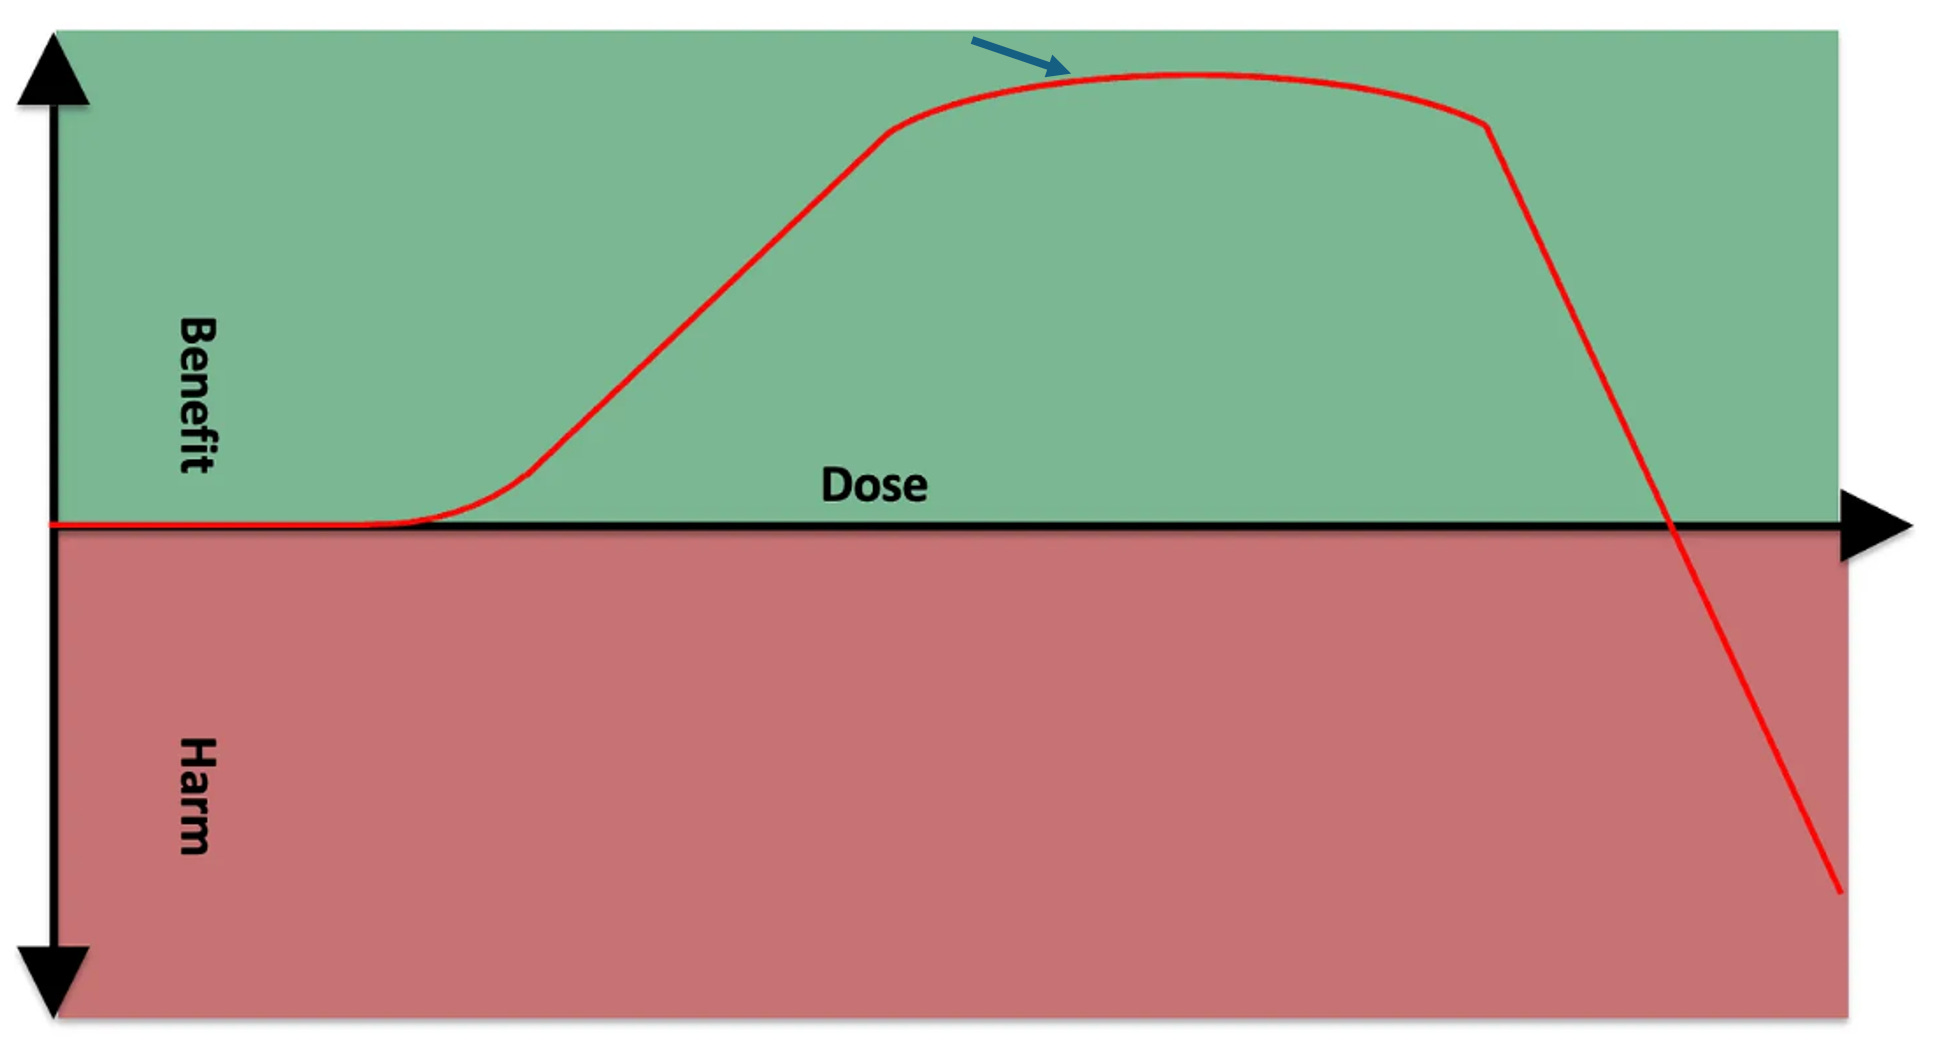
However, my position is that you want to arrive just before the point of diminishing returns:
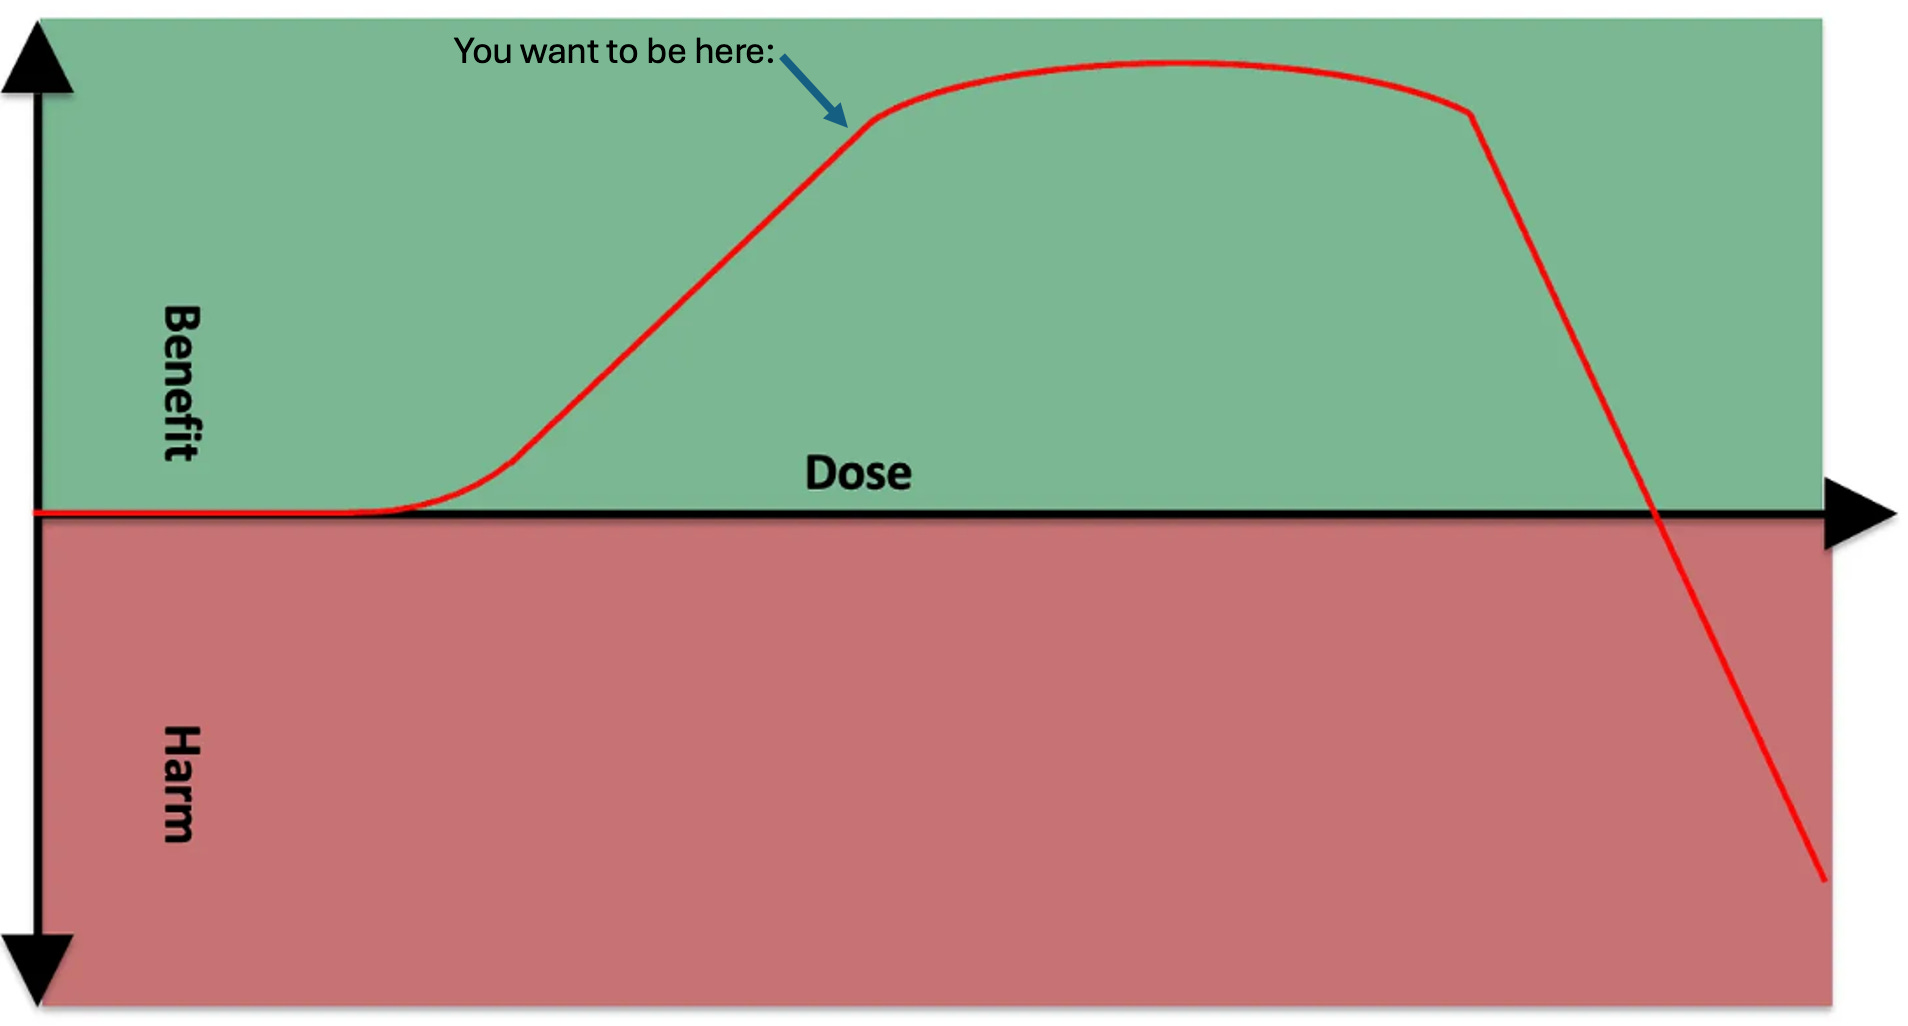
The way you get there is you titrate up until you hit diminishing returns, then pull back to the most recent dose that provide a large, obvious benefit.
If you interpret “minimal effective dose” to mean “the minimal effective dose to achieve the closest thing you can to maximal benefit while also maintaining the largest window of safety from loss of benefit and adverse effect which puts you at the point just shy of diminishing returns” then by all means call this “the minimal effective dose.”
The reason you want to be at this point is that this gives you nearly all of the benefit and gives you an extra margin of safety against an adverse effect.
Think of it this way: you are climbing up a hill. When you get to the summit, you can walk around a little on the flat top. However, walk a little further and you are on the edge of a cliff. One misstep and you can fall.
The primary misstep you are likely to have made here is that your view of how long you had to spend hiking up the hill to actually know where you landed had been unrealistically short. You think by holding the dose steady you are staying in the same place, but actually you are slowly drifting toward a higher and higher cumulative body store of the nutrient over time, and slowly upregulating pathways that are either designed to get rid of the extra or use what is available toward some purpose. If you stabilize before the plateau, you have a large margin where you can slip forward and nothing bad happens. If you stabilize on the edge of the plateau, however, your margin of safety is much smaller and you are more likely to stumble your way into an adverse effect over time.
More guidance will be given on how long to spend in each trial in the next section.
First, we clarify some more points in how to determine where on this graph you are.
Your initial dose should always be the lowest expected to have any effect.
If what you are testing is a well characterized nutrient found in food, your lowest dose should be based on the dietary reference intakes characterizing the basic requirements for the nutrient and, if available, studies suggesting variation in the amount derived from eating different foods impacts health outcomes.
On the other hand, if basic requirements are not well characterized or not characterized at all, the lowest dose should be based on randomized controlled trials showing human health outcomes of particular doses when available, and otherwise from case reports or anecdotal experience.
In my Protocols, I synthesize all these types of evidence to use the best available evidence for the purpose and characterize the most probable dose range to work within to gain the proposed benefit.
However, your requirement will not always and not even usually be the average requirement derived from existing studies.
Rather, you use the available data as a starting point and then you determine your requirement by slowly titrating the dose to just shy of the point of diminishing returns that you personally experience in the context of performing this scientific experiment on yourself.
The increment of your dose increases should match your starting dose.
For example, if you start with 6 milligrams of riboflavin per day, your next increment should be 12, and then 18, and so on.
You can then modify this according to your results. Specifically, if your initial dose does nothing and you determine that you are beneath the primary benefit curve, you can speed up your dose increase until you start seeing a benefit. Once you see the benefit, slow down.
One of the problems with interpreting dose increases is that a higher dose allows you to fix a deficiency faster, but once it is fixed, the higher dose is just a bunch of extra over your maintenance requirement. In these cases, it can help to use a loading dose or what I sometimes call a “flush” to flush maximal levels of the nutrient through your body over a short timeframe.
This is well characterized with creatine, where four to five days of 20 grams per day leads to muscle saturation that otherwise takes a month of 2-3 grams per day. When you know this to be the case, you want to reach muscle saturation in either one of these ways and then use a bottom-up slow dose titration to determine your optimal maintenance dose.
The purpose of this is just to clear out any state of “deficiency” as fast as you can so that the time you spend titrating your dose is used efficiently to find your maintenance requirement.
If you add a supplement or increase the dose and nothing happens, there are essentially two possibilities.
One is you are beneath the point of primary benefit:
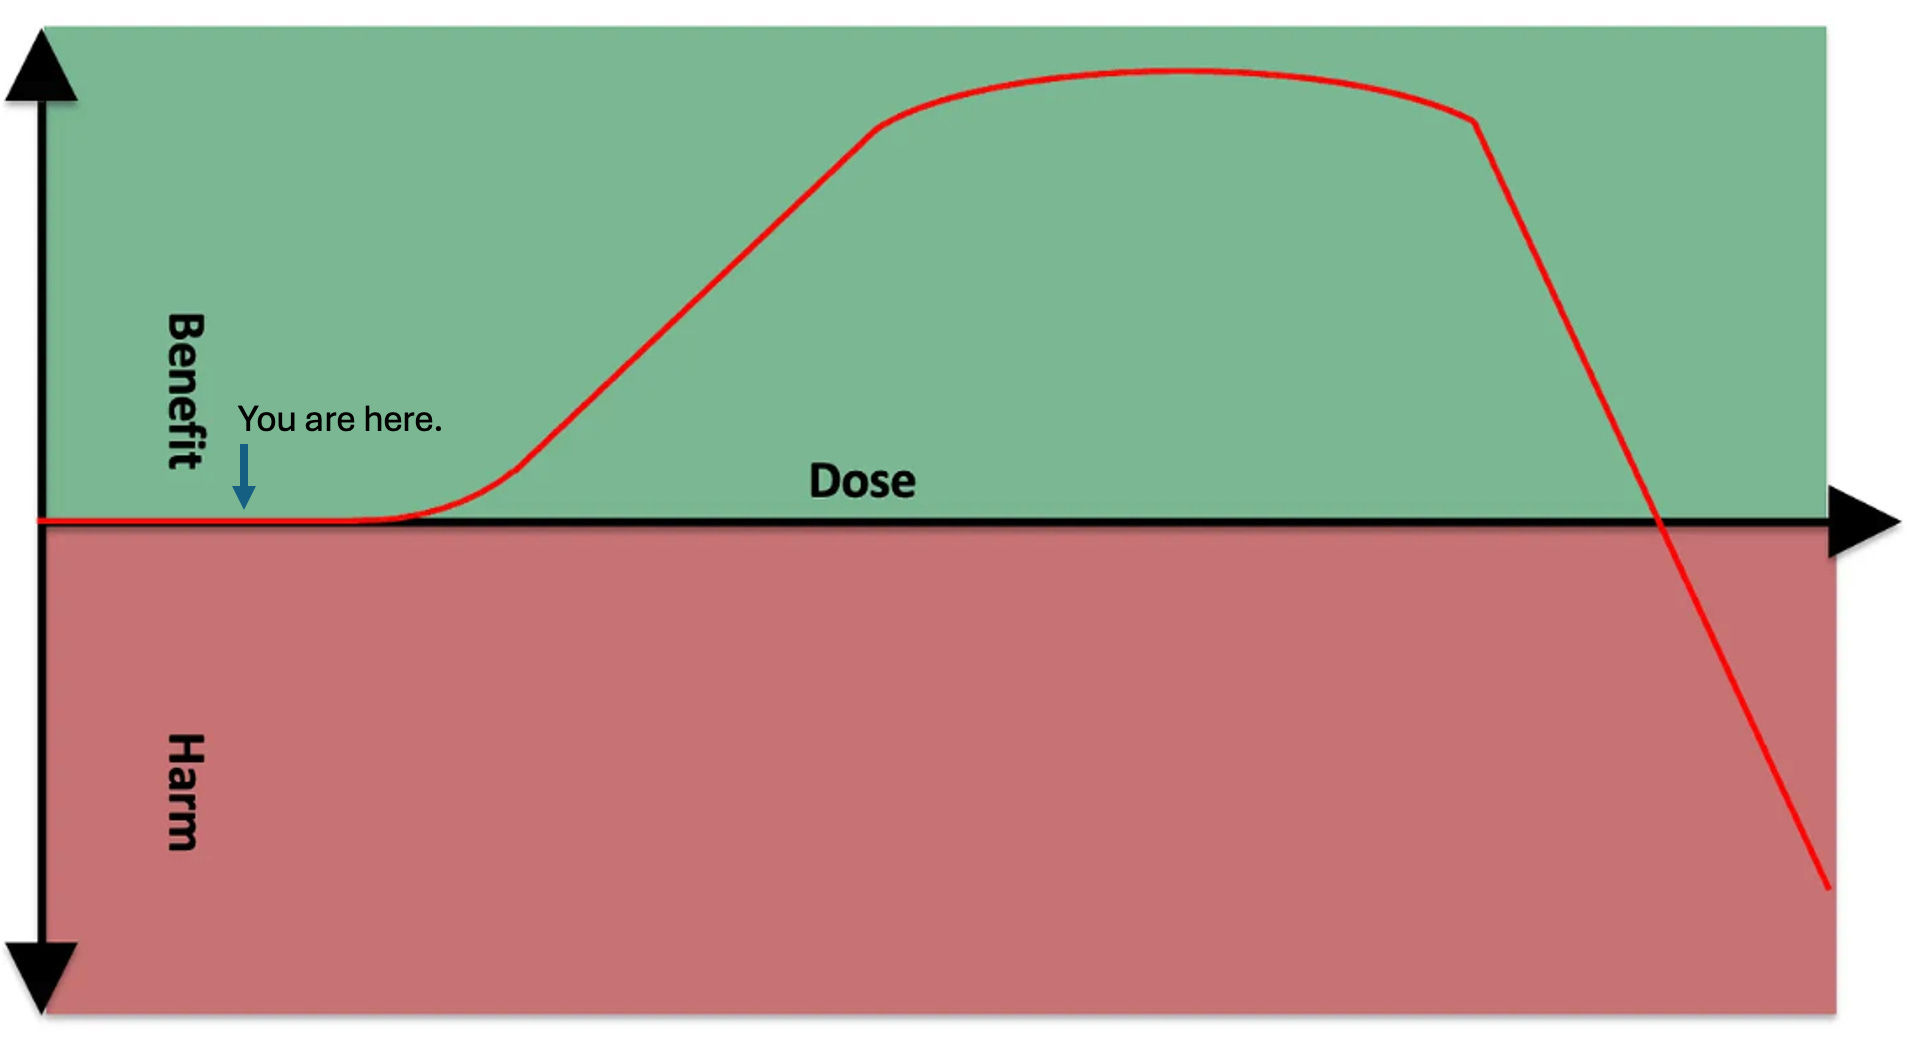
Another is that you are moving along the plateau point:
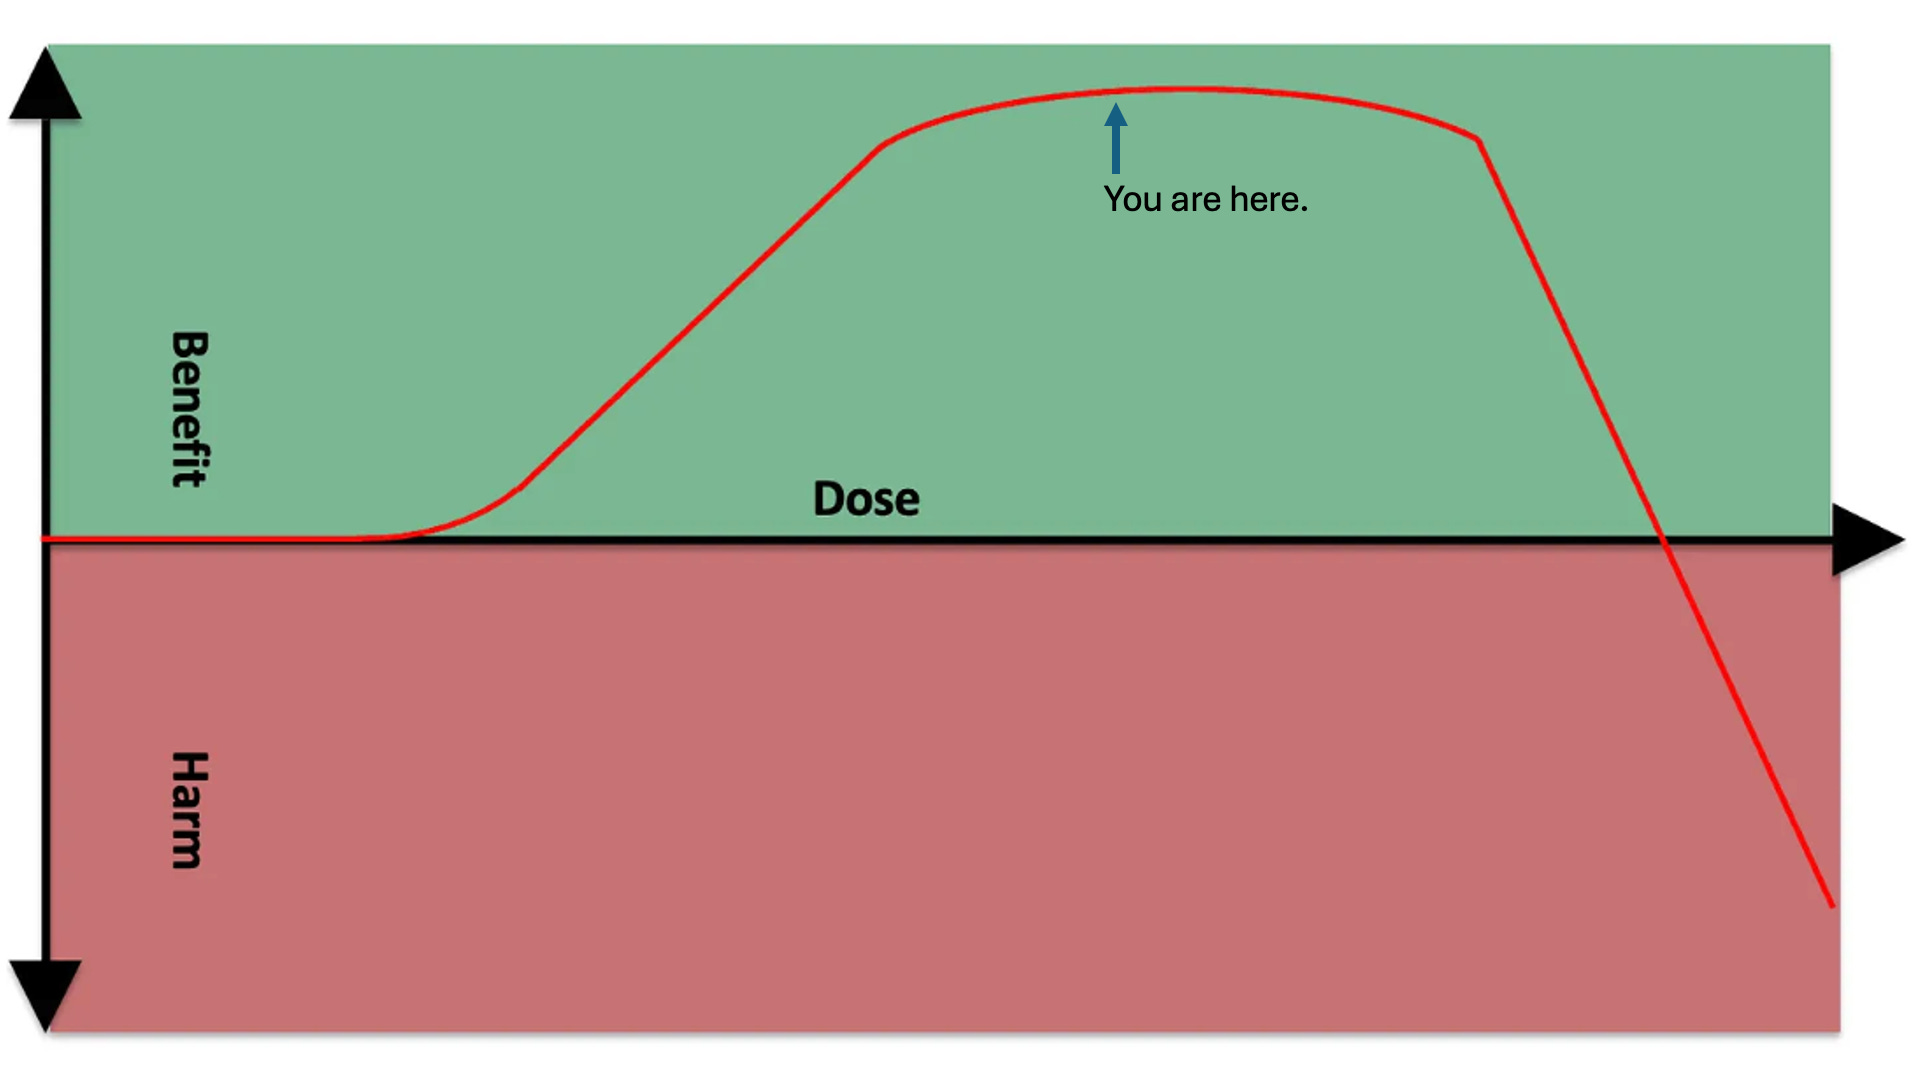
The only real way to know the difference is to increase the dose and see if you get a benefit or an adverse effect.
If you had started at the plateau point as your baseline, you have already accrued the benefit, so as you move on to the loss of benefit part of the curve, it will be experienced as an adverse effect.
Ultimately, you should derive the probability that one or other is true based on what is known from existing literature and human experience about the dose you are using. I continually update my Protocols to give you my best understanding of what to expect, so if you are using one, the bottom of the dose range should put you near the bottom of the primary benefit, not the top, so if nothing a happens your best assumption is that you need to increase the dose more to obtain the benefit.
However, if you are working on your own, it is easy to be misled. For example, there are many studies of riboflavin using 100 to 400 milligrams per day, but there are almost none testing 400 milligrams per day head to head against 3-5 milligrams per day and there are never any studies that give lower doses of vitamins extra time to work than the higher doses, which is what you need to do to truly show superiority of the higher dose. Go figure, what is primarily tested is never what actually needs to be known.
My current research is leading me to believe that almost no one has long-term maintenance needs for riboflavin above 5-6 milligrams per day, and most genetic factors that increase the riboflavin requirement above the population average move it from 1.6 milligrams per day to 3.2 milligrams per day.
If you decide to test the effect of riboflavin on your cramps and you have been consuming five milligrams of riboflavin per day from food for the last five years, there’s a pretty good chance that additional riboflavin will do nothing and it’s because you have already accrued the benefit of higher-than-average riboflavin intakes.
By contrast, if you are consuming the population average of 1.6 milligrams per day of riboflavin, or less than that, or you have only been consuming five milligrams per day for a month or two, there is a high chance that boosting your riboflavin gives you additional upside.
On the other hand, I cannot rule out that there are rare genetic mutations that really do require 400 milligrams per day. So I include this as an upper dose in my protocols, but also make it clear that the average person probably tops out the benefit at 5-6 milligrams per day.
Ultimately, the only way to know where you are is to continue the test to see if dose increases make things better or worse.
Another interpretive problem is that we don’t know whether an adverse effect is an intrinsic problem with the dose or is due to a contextual factor being out of balance.
For example, you may experience an “adverse effect” by fixing a problem too fast and your body needs to undergo various adjustments to allow the fix to operate in a way that provides a clean experience of a benefit.
For example, you may be deficient in creatine and this is leading to whole-body intracellular potassium depletion because you cannot efficiently use cellular energy in the form of ATP to bring potassium inside of cells. Too much creatine too fast could start fixing this, making potassium go into your cells and causing the serum levels to drop, causing heart palpitations. Your potassium supply becomes the relevant contextual factor, and you can either a) drop the creatine dose to move potassium into your cells more slowly, b) wait it out and allow your body to adjust, which might take weeks or even months, or c) supply the extra potassium so that you have enough to go around.
If there are predictable contextual factors that could be driven out of balance while fixing a problem, I include them as if-then contingency plans in my protocols.
If you are unsure, you can simply treat it as an adverse effect. If you hit an adverse effect, you pull back on the dose.
If you immediately hit an adverse effect at the lowest dose, cut it in half or a third. Keep going down to the lowest practical dose to see if you can find the “primary benefit” part of the curve. If you cannot find a dose that has benefits without adverse effects, discard the strategy.
In order to properly find the point of diminishing returns, your dose increments have to be small enough to not pop you suddenly from “primary benefit” to “adverse effect,” and you have to move slowly enough so that you determine the effect of any given dose based on its final resting point, not a snapshot of your health in motion as the dose moves you from one point to another. That means that any health changes you observe must fully stabilize before moving from one dose to the next, or from one protocol step to the next.
In the next section, we look at how to determine how long you give any dose to show its final effects.
The most important point to take away from this current section is this: start with the lowest dose that has plausible efficacy, titrate up as slowly as is practical until you hit diminishing returns, then pull back to the last dose that had a large benefit.
How Long to Spend At Each Dose
Whenever you make a change, there are biochemical, molecular, cellular, physiological, and epigenetic changes that are distributed over different time horizons. Some of these happen over fractions of a second, some over minutes, some over hours, and some over days. This is complicated by the fact that any effect has knock-on effects that are secondary, tertiary, and so on, cascading into changes with their own time horizons. At some point we hit knock-on effect layers that we don’t know enough to predict and simply cannot guess their time horizons.
Some of these could involve tissue remodeling, and these might take a longer time and be somewhat more stubborn.
The epigenetic fraction of these changes has the most variability in its time horizons. Many of these changes occur over a span of hours and ebb and flow with, for example, the fasting-feeding cycle. Others occur during development, and the window of time in which they occurred raises their perceived importance to render them permanent or at least quasi-permanent and difficult to reverse. It is likely that highly sustained signaling becomes progressively more difficult to reverse the longer it is sustained. For example, if you have a situation that persists for years, it could conceivably take years to reverse.
Effects are often multi-phasic.
For example, during water fasting, you will deplete your liver glycogen over the course of 24 hours, and during the first day you will progressively shift from using stored carbohydrate (glycogen) to using newly synthesized carbohydrate (gluconeogenesis) over time. Your ketone synthesis will ramp up, but over 3-5 days ketones will shift from feeding muscles to feeding the brain, and muscles will shift from using ketones to using fatty acids. At five days, you are solidly “keto-adapted,” a position you have reached much more quickly than people using moderately ketogenic diets because water fasting is a much stronger stimulus for adaptation. Yet, as you get weeks into a water fast you will have a secondary phase of muscle catabolism, and as you get months into a water fast you will get into a fatal third phase.
If you take something less well-characterized, like 400 milligrams of riboflavin, you might have an early phase characterized by rapidly fixing a deficiency. You then may have a second phase that lasts weeks or months where you gradually increase your ability to burn fat. This might be net beneficial until it hits a tipping point 3-6 months in where it leads to lost fat in the face, creating a more hollowed out look; eczema from inadequate skin lipids; or progressively worsening glucose tolerance as fat begins to displace glucose as a preferred fuel but your carb intake has remained as high as it always was.
The longest randomized controlled trial of a dietary strategy in existence is the LA Veterans Administration Hospital Study, which looked at the impact of substituting “seed oils” for traditional fats. The initial benefit to cardiovascular disease wore off over the course of the eight years. The rise in cancer did not even start emerging until year two and mostly took off after year 5. The total mortality was unchanged throughout the study but looked at the end like it was starting to favor traditional fats around year eight. The authors concluded the trial wasn’t anywhere near long enough to see the true effect. This trial emphasizes that dietary impacts can take years to reveal their full effects.
The point here is that there are too many relevant time horizons for us to say definitively when an effect has truly stabilized, so when deciding how long to stay on a given dose you need to artfully mix the science of dose-response with the practicality you require.
There may be cases where we already know a lot about how long something should take to stabilize. In this case, we should initially assume as our base case that we are similar to other people. For example, we know how long creatine takes to saturate muscle stores and we know how long keto-adaptation takes. If we know we should expect these lead-in phases, we should let them run their course and then start the clock looking for stabilization.
Once we are beyond any expected lead-in requirement, I recommend giving any given dose at least one week.
However, it then becomes your job to look for changes in your health and ensure they have the chance to stabilize.
A week should allow most of the first-phase epigenetic changes to settle in. While there may be other phases down the road, they tend to be months out rather than linearly accumulating. If they are linearly accumulating, you will see this clearly in your health metrics failing to stabilize. If they are months out, you will waste too much time if you wait for them. You can always revisit your protocol if something seems to be out of balance by reducing the dose of something or eliminating it altogether if it seems to have run its course.
You can protect against benefit-to-adverse-effect transitions by avoiding megadoses unless they prove absolutely necessary, by focusing on foods instead of supplements, by being slow and methodical in your initial dose titration, by never ignoring adverse effects even if they are subtle, and by aiming for the point just shy of diminishing returns instead of the absolute maximal benefit, and by not blindly copying the dose that someone else on the internet is raving about.
There are various ways to assess whether something has stabilized.
First, you want to take stock of what you already know about the variability in what you are measuring. For example, if it is your past experience that your deep sleep ranges from 1-2 hours per night and that when it hits 2 hours it often stays there for two weeks and then reverts back to the mean of 1.5, you must take that into account. If you decide that 5 milligrams per day of apigenin has increased your deep sleep from 1.75 hours a night to 2 hours a night, you cannot decide it has stabilized after one week of staying right at 2 hours a night when you know from past experience that your deep sleep often does that without apigenin. You will have to take this knowledge into account and impose a rule that your deep sleep hitting 2 hours a night does not even register as a signal above the noise until it surpasses your previous all-time best of two consistent weeks of 2 hours per night. Then you start the clock for it stabilizing.
Once you take into account your expected background variability, you can look for stabilization visually or mathematically. If you plot your data as a line graph, you can simply look at whether the line is straight, and whether it has clearly spent more time being straight than it usually does prior to having introduced your intervention or your current dose of that intervention. Or, whether it has some ups and downs but you could easily draw a straight line through the average of those ups and downs that is straighter than any previous line you could have drawn or simply is in a new, better place than any straight line you could have drawn through the data.
The way I prefer to do this is as follows:
Determine what margin of error you will tolerate. For example, say I want my morning glucose to be 78-85. If I’ve gotten it down to 82, I can probably tolerate a span of 3 points up or down for my own satisfaction.
Calculate the 7-day rolling average, the 3-day rolling average, and the average for all measurements taken on that particular dose. If you are carrying the experiment on for more than a month, add to this the monthly average.
If all the averages are within the accepted margin of error of each other, see if there is a trend from longer-term averages to shorter-term averages to your most recent measurement that all point in one direction. For example, If so, give yourself a little more time. If not, you have stabilized.
If your averages are within the margin of error but all pointing in one direction, simply keep taking measurements until they are no longer pointing in a direction.
If you see an initial adverse event, you can either immediately pull back on the dose, or you can give it three or four days for it to turn around. Never let an adverse effect keep getting worse for more than three or four days, and never let it get dangerously bad.
If you are seeing a benefit, stay on the dose until the duration and magnitude of benefit provide a clear signal that rises above the background noise and until the benefit stabilizes as assessed visually or mathematically.
Move your dose up to the next increment, and stabilize again. Keep repeating this until you reach the point of diminishing returns, and pull back to the most recent dose before that. Then you can move on to your next strategy.
The Ultimate Optimization Spreadsheet automatically visualizes your daily data alongside the 3-day, 7-day, and 30-day averages and puts your protocol step average into a table. In this case, you want to see that the averages are clustering together and flat, and that there is no recent divergence from that pattern by the daily data or 3-day average.
When to Randomize
If you arrive at some new level of health that has proven to be a stable benefit, some might question how sure you can be that your protocol is exactly what did that, but you have the benefit and that is what matters.
Suppose, however, that you initially seem to have a solid benefit and it starts to lose its stability over time.
You may start questioning whether the effect was real.
This is a good time to consider performing a randomized controlled trial on yourself.
For many strategies, especially foods and exercise, it will be impossible to blind yourself and control with a placebo, even with the help of a friend or professional. However, randomizing repeated periods will help evenly distribute the confounders across your trials and will give you a much better ability to make a conclusion about causation.
You should randomize when all of the following are true:
You are unsure about the effect of something despite having tried it using the approach outlined above.
It seems plausible that there is an effect that is large enough to be worth doing this randomized trial to figure out.
There is some downside to “just doing it anyway” such as time or money you don’t want to waste, or some tradeoff effect that you are also unsure about.
The timeline on which you expect to observe the effect, including any lead-in time required for the effect to onset and any washout time needed for the effect to stop persisting after you stop the intervention, is one you are willing to repeat some six to twelve times.
One example could be that you believe that 200 grams of net carbs per day leads to a half hour better sleep than 100 grams of net carbs on the same night you consume them, but you have about two hours of variability in your sleep that are determined by whether your kids wake you up during any given night. Every time you think you are going to see this stabilize, your kids start waking you up more, so you really aren’t sure you’re right.
In this case you expect the carb influence to act on a one-day time horizon, and 30 minutes of extra sleep is actually very meaningful, but you are having trouble distinguishing that 30 minutes from the much larger variability caused by the kids.
If you randomize your carbohydrate intake, you can effectively separate it from the influenced of the ups and downs of your kids, and do a statistical test to give greater confidence.
If your kids are acting in a multi-day cycle where any two days in a row they are acting relatively similarly, you can do a paired statistical analysis where each pair of opposite-carb days are matched with one another to increase the statistical power.
Or, let’s say you are investigating the same question but your menstrual cycle impacts your sleep even more than the carbs. You can do a paired statistical analysis where each pair of opposite-carb days occurs within a tight two-day block of your menstrual cycle, allowing the stats to automatically control for your cycle.
If you know you have a regular, cyclical variable as a confounder, you can also do post-hoc analyses where you visually inspect the data to see if, for example, carbs only add to your sleep during ovulation, or if they benefit your sleep in the follicular phase and hurt it in the luteal phase.
You will need to randomize blocks of time that allow your effect to take place. If it takes you four weeks to keto-adapt, and a keto diet benefits your sleep after the four-week time point, and it takes one week to unwind the keto-adaptation, you are going to have to randomize 7-week periods just to get one solid week of keto-sleep. You might consider this deeply impractical.
Similarly, if you are trying to build muscle, it might take you twelve weeks of a program to get any measurable sign of progress, and if you randomize pairs of training regimens it could take you years to get clear differences. This is effectively impossible, or at least a ridiculously unwise strategy compared to tweaking your training regimen with expected improvements every twelve weeks and keeping what seems to work while discarding what doesn’t.
Or you might have to make an executive decision around something that seems a bit inconvenient but could be practical if the information is valuable enough. For example, if your observational period indicated that you can consume a pound of beef per day for four days before it starts increasing your anxiety, and the effect washes out after two days of no beef, you will need to randomize pairs of one-week periods just to get one day of beef-induced anxiety. This might take a while, but if you are genuinely unsure whether otherwise seemingly random panic attacks are driven by beef consumption this might be very important to you and well worth randomizing.
Here is how to randomize:
First, determine whether you fit the bullet point criteria outlined above and only randomize if each bullet point is true.
Determine what your intervention and control is. If you are adding something new, your control is without it and your intervention is with it. If you are increasing the dose of something, your control is the lower dose and your intervention is the higher dose. If you are simply changing from an old protocol to a new one, your old protocol is the control and your new one is the intervention.
Determine what your primary endpoint is. This is the target you are trying to optimize.
Determine from your observational period (that is, your attempt to try the regimen and stabilize on it as outlined in the previous three sections) whether there is a necessary lead-in time (the time on the intervention until the effect onsets or stabilizes) or washout time (the time off the intervention before the effect wears off). Make the periods you are randomizing long enough to get your observed effect after any necessary lead-in time, and schedule any necessary washout periods between your randomized periods.
Determine how many pairs of periods you will randomize. As a default, I recommend doing six randomized pairs, so 12 total intervention periods.
If you want to go the extra mile in setting this up for statistical success, you can use a sample size calculator. If you arrived at the randomized controlled trial because you did an observational (try it, track it, and see if it works) period first that produced confusing results, this is your preliminary data. Your preliminary data will be sequential over time rather than paired, but you are going to be randomizing pairs of trial periods. Your preliminary data from the observational period will be more fit to use for a parallel design sample size calculator, while a paired t test sample size calculator might actually be better for your trial design.
My recommendation would be to use the parallel design calculator and be aware that this might recommend a higher number of pairs than you actually need. This is a good thing, however, because it ensures better stats. Use your spreadsheet to calculate the average and standard deviation of your primary outcome for your control condition and your intervention condition. If the standard deviations are considerably different, use the condition with the larger standard deviation for “group 1” and use the one with the smaller standard deviation for group 2. Fill in the average and standard deviation for group 1, and the average for group 2. If you want to err on the side of a more burdensome study to gain more statistical power, shift the power from 80% to 90% and change the alpha from 0.05 to 0.01. Otherwise leave them at their default settings. Then click “calculate.” The total number per group is the number of pairs you have to randomize.
If the number of pairs recommended seems impractical, try this: pre-specify that you will analyze your data at the half-way point. If you have convincing results you will stop the trial there. If you have results that seem promising but uncertain, you will carry it on until the full number of trial periods have been finished.Make two orders: control then intervention; intervention then control. You can randomize by flipping a coin or by using a random number generator. Assign one order to heads and the other to tails if you are flipping a coin; assign one order to 1 and the other to 2 if you are using a random number generator. Write these down before you flip the coin or use the generator. Since we have a small number of trials, I like to pre-specify that every order is used an equal number of times. With this rule, the coin or the generator is used to determine the sequence up until the point where one order has already occupied half of the slots; after this point, the other order is used for the remainder of the slots. With the rules in place, flip the coin repeatedly until you’ve determined your full sequence. Or, set a random number generator to a minimum of 1 and a maximum of 2 and hit “generate” until you’ve determined your full sequence. Write down the details of how you randomized, what rules you pre-specified, what the actual coin flips or random numbers were in what sequence, and how you translated that into your trial order.
NEVER ignore coin flips or random numbers generated or keep hitting them extra times. Either your rules were pre-specified or you need to start all over if you messed something up. Once you modify the design post-hoc, you have introduced bias. Pre-specify your rules and then obey the coin flip or number generator.Record all your data in your optimization sheet normally. Use the “Protocol Change” to note your randomized experiment and which trial period you are on in any given day. Keep track of your experimental design and results in a second tab of your sheet dedicated to that experiment. Copy over the relevant data from the first sheet to the second so that the second sheet has your experiment organized according to your experimental design. At the end, you want to be able to easily calculate averages from your control and your treatment.
At the end of your experiment, calculate the averages for the control and intervention so that you can assess whether the effect is meaningful to you. For example, if something added 20 minutes of sleep that is probably a good gain, especially if you feel more well rested in the morning or more energetic during the day, and that is more important than the statistical significance. Ultimately, however, that is something you have to judge based on your own values and desires and what costs might be incurred by carrying out the intervention over the long-term.
Use the Graphpad t-test calculator to test for statistical significance. Choose “enter or paste up to 2000 rows.” You can then copy and paste from your spreadsheet the control values in the group 1 column and the intervention values in the group 2 column.
You should now reflect on how “paired” your pairs were. On the one hand, you randomized the pairs so you are completely justified in using a paired t-test. On the other hand, you probably only have genuine biologically significant pairing if you have real trends over time that were impacting your primary endpoint. For example, if your menstrual cycle impacts the trials and they were all done in one month, each pair will be tightly tied to a specific part of your menstrual cycle and pairing makes a lot of sense. If you did your trial in March and it was the first month of the year you spent outside, you might have cumulatively increasing vitamin D status and other benefits of sunlight exposure and each pair of trials will be tightly tied to a specific point of that accumulation. Pairing again makes a lot of sense. On the other hand, if no such cycles existed and you have a lot of random variation that hit you randomly across your experiment and never lasted more than one day at a time, pairing might not be best. You can try the calculator with both “unpaired t test” and “paired t test” and see what makes the most sense to you.
If you use a paired test, you have to enter the data at the level you randomized. For example, if you randomize pairs of ten-day periods, you need to enter the average for each ten-day period instead of the daily data, and the 10-day periods that were paired with one another need need to occupy the same position in their respective columns of data.
In general, getting below 0.05 is considered statistically significant, but this cutoff is arbitrary. Your goal is to convince yourself, not publish this in peer review, so you can be a bit liberal in your interpretation of the stats. A lower p value gives you higher confidence your results are real.
The calculator gives “two-tailed” results. This assumes that your results could be different in either direction. If you have a strong hypothesis about the direction of your experiment and would be willing to give up the ability to test whether the opposite result were true, you can cut the p value in half to get “one-tailed” results, which will be much more likely to be statistically significant.If you are convinced by the results of your trial, reflect on whether the benefit is worth whatever cost might be involved. If it is, incorporate it into your regimen, and move on to your next optimization target or strategy. Don’t randomize again until “try it, track it, and let it stabilize” gives you another set of confusing results that are worth randomizing.
Randomized Self-Experiment: An Example
In my own optimization studies, I found that 24-hour whole wheat sourdough seemed to better promote sleep than white rice, nixtamalized corn, Ezekiel bread, or any other carb source I had tried when equating for net carbs. However, I had found this intermittently without intentionally testing it.
Unfortunately, I have also determined that anything with fructans in it hurts my gastrointestinal function to at least a mild degree, and this made 24-hour whole wheat sourdough a tradeoff due to its fructan content.
Nixtamalized corn has proven to be the whole-food carb source I can best tolerate as a generic source of carbs if I am to, for example, replace fat calories with carb calories without a big impact on other aspects of my diet.
Thinking the impact of sourdough on my sleep was probably real, I considered that its pro-methylation potential due to its choline and trimethylglycine (betaine) could be responsible. The only other carb source with that type of pro-methylation profile is quinoa, due to its high trimethylglycine content. The main downside of quinoa is its substantial oxalate content.
I tried replacing corn with quinoa, and I tried comparing this to replacing fat sources with enough extra egg yolks to equate the sum of choline and betaine.
My initial results made it look like quinoa was unique in optimizing my sleep, but may have also been hurting my energy:
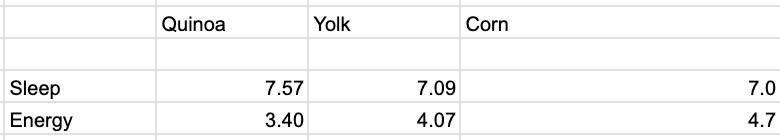
Sleep is in total hours per night and energy is self-rated as described earlier.
However, the longer I stayed on the quinoa the more this differential seemed to collapse:
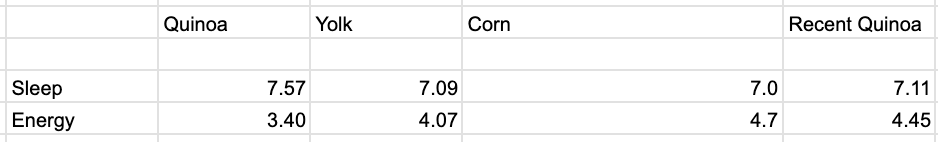
When I looked over the data, it appeared to me that these ebbs and flows could more easily have been explained by the fact that I was increasing my calories after transitioning from a leaning-out to a weight-maintenance phase, that my workouts were being adjusted according to my current goals, thereby impacting how much recovery I was needing, and that my sleep was largely following how much I needed rather than how much I was able to get.
The results seemed sufficiently confounded and confusing that I decided to randomize.
I did not conduct a power calculation. Instead, I decided to run six pairs of trials with equal numbers of corn-quinoa trials as quinoa-corn trials.
Since I do food prep in batches that last four days, each pair of trials lasted eight days, either with four days of corn and then four days of quinoa or with four days of quinoa and then four days of corn.
I pre-specified that I would have an equal number of each order, and used a random number generator to generate the sequence. 1 meant corn first, 2 meant quinoa first. The random number generator gave me the sequence 2,1,1,2,2. Since there was only one slot left and 2 had already been used three times, the last spot automatically went to 1 by virtue of my rule. This led to 2,1,1,2,2,1, which translated to quinoa, corn, corn, quinoa, corn, quinoa, quinoa, corn, quinoa, corn, corn, quinoa.
I did not observe any trends indicating a need for a lead-in period or a washout period, so the trials straightforwardly reflected my four-day food prep cycle.
Since I am randomizing blocks of four corn day then four quinoa day versus blocks of four quinoa days then four corn days, and because the main purpose of the pairing is to avoid heavy clustering of the trials over time, the data can either be analyzed at the daily level in a unpaired t-test or in the four-day block level in a paired t-test. The idea behind pairing is that any given eight-day period had something similar within itself that was generally different in the other 8-day periods, and that might line up to something like the ebb and flow of my workout and recovery periods.
My trial is currently 83% complete, and these are the preliminary results:
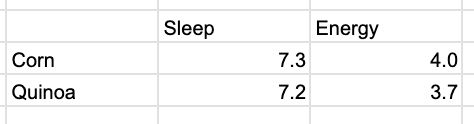
The sleep is not even close to statistically significant at p=0.57 for an unpaired test and nearly identical results for a paired test.
My energy difference is not statistically significant, but it is a lot closer, reaching 0.24 or 0.25 depending on whether I use pairing. These are two-tailed t-tests, which aim to express equal skepticism toward quinoa helping or hurting my energy. Given that my initial results suggested quinoa hurt my energy and that I could attribute this to its oxalate load, I think it is fair to say I had a specific one-sided hypothesis and could use a one-sided t-test, which would be half the p value of a two-sided test and be 0.12.
This means that there is a 12% chance I would have observed results with an energy difference equal to or greater than this if quinoa has no genuine impact on my energy.
For my purposes, I conclude that quinoa does mildly hurt my energy. This wouldn’t fly in a peer reviewed paper, but my odds are 88% versus 12% so I’ll take the 88%.
I do intend to finish the last two trials to arrive at the final stats, but I am leaning toward excluding quinoa from my default food selection and keeping corn.
A note about the sample size calculations. In my preliminary data, my sleep after eating quinoa was higher on average, but it was also more volatile. Had I used my preliminary standard deviation for a sample size calculation, it would have told me to randomize 23 pairs. One downside to using the sample size calculation is that if you are purposefully running a randomized experiment, your standard deviation will probably go down. For example, if I use my current standard deviation within my experiment alongside the preliminary group averages from my observational data, it suggests I need 12 pairs to make a 7.0 versus 7.57-hour sleep difference statistically significant. This is twice what I have but half as many as the preliminary results would have suggested. Thus, if you get a wildly high number for the sample size calculation you can probably cut it in half if you practice rigorous controlling of variables during your randomized experiment.
Again, a good compromise here is to take the number recommended, and pre-specify that you will analyze your data at the half way point and stop if the results are convicning.
You don’t want to stop at a random point you didn’t pre-specify, because this will create bias by making you likely to stop whenever the results look the way you want them to.
At this point, the difference in my sleep has collapsed to 0.1 hour or six minutes. That won’t become significant by doubling the number of trials and I wouldn’t care if it did, because six minutes of sleep isn’t worth changing my diet over.
By contrast, the p value for the difference in energy might stay as low or decline in value further after completing the last leg of the experiment, and while it might not reach statistical significance, I expect the odds will continue to favor corn over quinoa for energy, which is convincing enough for me to stick to corn as a default carb source.
Nevertheless the primary conclusion from this experiment is that the initial perception that quinoa was helping my sleep was wrong, and I effectively refuted my hypothesis quinoa would increase my sleep due to its choline and betaine content.
When You Are Done Optimizing
You are done optimizing once you are getting the results you want or you have run out of strategies.
If you are now getting the results you want, revert to “if it ain’t broke don’t fix it.” You should take a rest from changing things, and should focus on maintaining your results.
If you are doubtful that everything you have accumulated into your regimen is necessary for those results, you can use this optimization protocol to slim down your regimen. Focus on stability of your previous optimization targets as you use the exact same protocol framework to remove things instead of adding them.
Once you are confident in your ability to maintain your benefits, you are now free to exit the optimization sequence, or to pick another optimization target. If you pick a new optimization target, you should still track your previously optimized targets. Make sure optimizing your new target either doesn’t interfere with your previous gains, or only does so in a way and at a magnitude that you are willing to accept as a tradeoff.
If you are not yet happy with your results but you have run out of strategies, you may want to take a rest and “deload” from optimizing. Once you feel rested and ready to go again, focus on studying and learning until you find something new to “try and see if it works” or to use with this optimization protocol.
Staying Optimized Over the Long-Term
Over the long-term, you may find that a particular strategy wears off or that your needs have changed, or that something that was helping you for a period of time is now hurting you.
If a strategy wears off you may simply need a new one. If your needs changed, you may need to optimize with a different target in mind. If something that helped you short-term is hurting you long-term, you should use this optimization protocol to test the impact of removing it the way you tested the original impact of including it.
In my Protocols, I will build into specific protocols things to look out for when you’ve been using the strategies for too long.
Some things to be suspicious of:
Doses of supplements that are much higher than my custom nutrient targets.
Superfoods that provide certain nutrients at levels much higher than those targets.
Foods that provide necessary nutrients but that you do not digest well.
Any herbal medicines or pharmaceuticals.
Exercise regimes that have been too much for too long.
Even if you exit the optimization cycle to simply enjoy life, you should check back on a quarterly basis with your previous optimization targets, as long as you still value them, to see if you are staying optimized.
For example, you should not need to optimize your glucose every day, but if you are optimizing it you definitely should measure it every day until it is optimized. If you spent two months optimizing it and then exit the optimization cycle, you should, on a quarterly basis, take whatever number of measurements you previously found was needed to capture representative variability. If you had optimized it to 82 mg/dL, catching it at 95 mg/dL is better than letting a problem under the hood go on until you’re at 110 mg/dL.
Or, perhaps you had optimized your strength on certain lifts and moved on to other physical feats. Check back with those lifts from time to time so you have a leading indicator of having lost your previous progress.
You may in the future reflect back on your optimizations and find that some of them were well worth it, and others were fleeting obsessions that you no longer see the value in. The more you reflect, the more you can whittle down the number of things you need to check in on.
The more you do this, the more you refine your conception of what is and isn’t worth optimizing, and the greater the return you get whenever you decide that it is worth taking another trip into the cycle of optimization.
The Next Step: Identify What You Want to Optimize
Start with my top three tests to run for game-changing health results!
3 Tests to Transform Your Health (and Your Lifespan)
If you are already doing What Everyone Should Be Doing For Their Health and there are still things you want to improve about your current health or that you want to optimize to protect your future health and longevity, it may be time to do some lab testing beyond whatever your doctor orders for you in your checkups.
Wow! You are really serious about this optimization stuff, aren't you! I can't believe it. This appears at a good time for me as I have been trying to optimize my blood pressure (with lots of problems) and I am having trouble with changing variables and meds, etc. I will definitely take a more in depth look at this. Thank you for the effort you took to do this and sharing it with us.
It is such a profound realization to see life and energy as a flowing, quantum space through which we navigate — projecting and perceiving it in our own unique ways. I feel immense joy in the synchronicity that has brought me to your work at this very moment.
Your passion for uncovering and decoding the very foundations of life is truly inspiring. What you have created is not only knowledge but also a complement to what so many of us feel deep within — the desire to understand, to heal, and to sustain the flow of energy that gives us life.
I can only praise and thank you for this remarkable contribution you’ve made to all of us. Personally, I feel a great passion to learn the metabolic pathways as you describe them, and to explore the incredible healing power of nutrients that sustain our vitality.
Congratulations once again for your extraordinary work and dedication — it is a gift to us all.