
The Ultimate Guide to Optimizing Anything
My 8-page quick guide that can be used to pair with any protocol to guarantee you get the results you are looking for.

This is the Ultimate Guide to Optimize Anything.
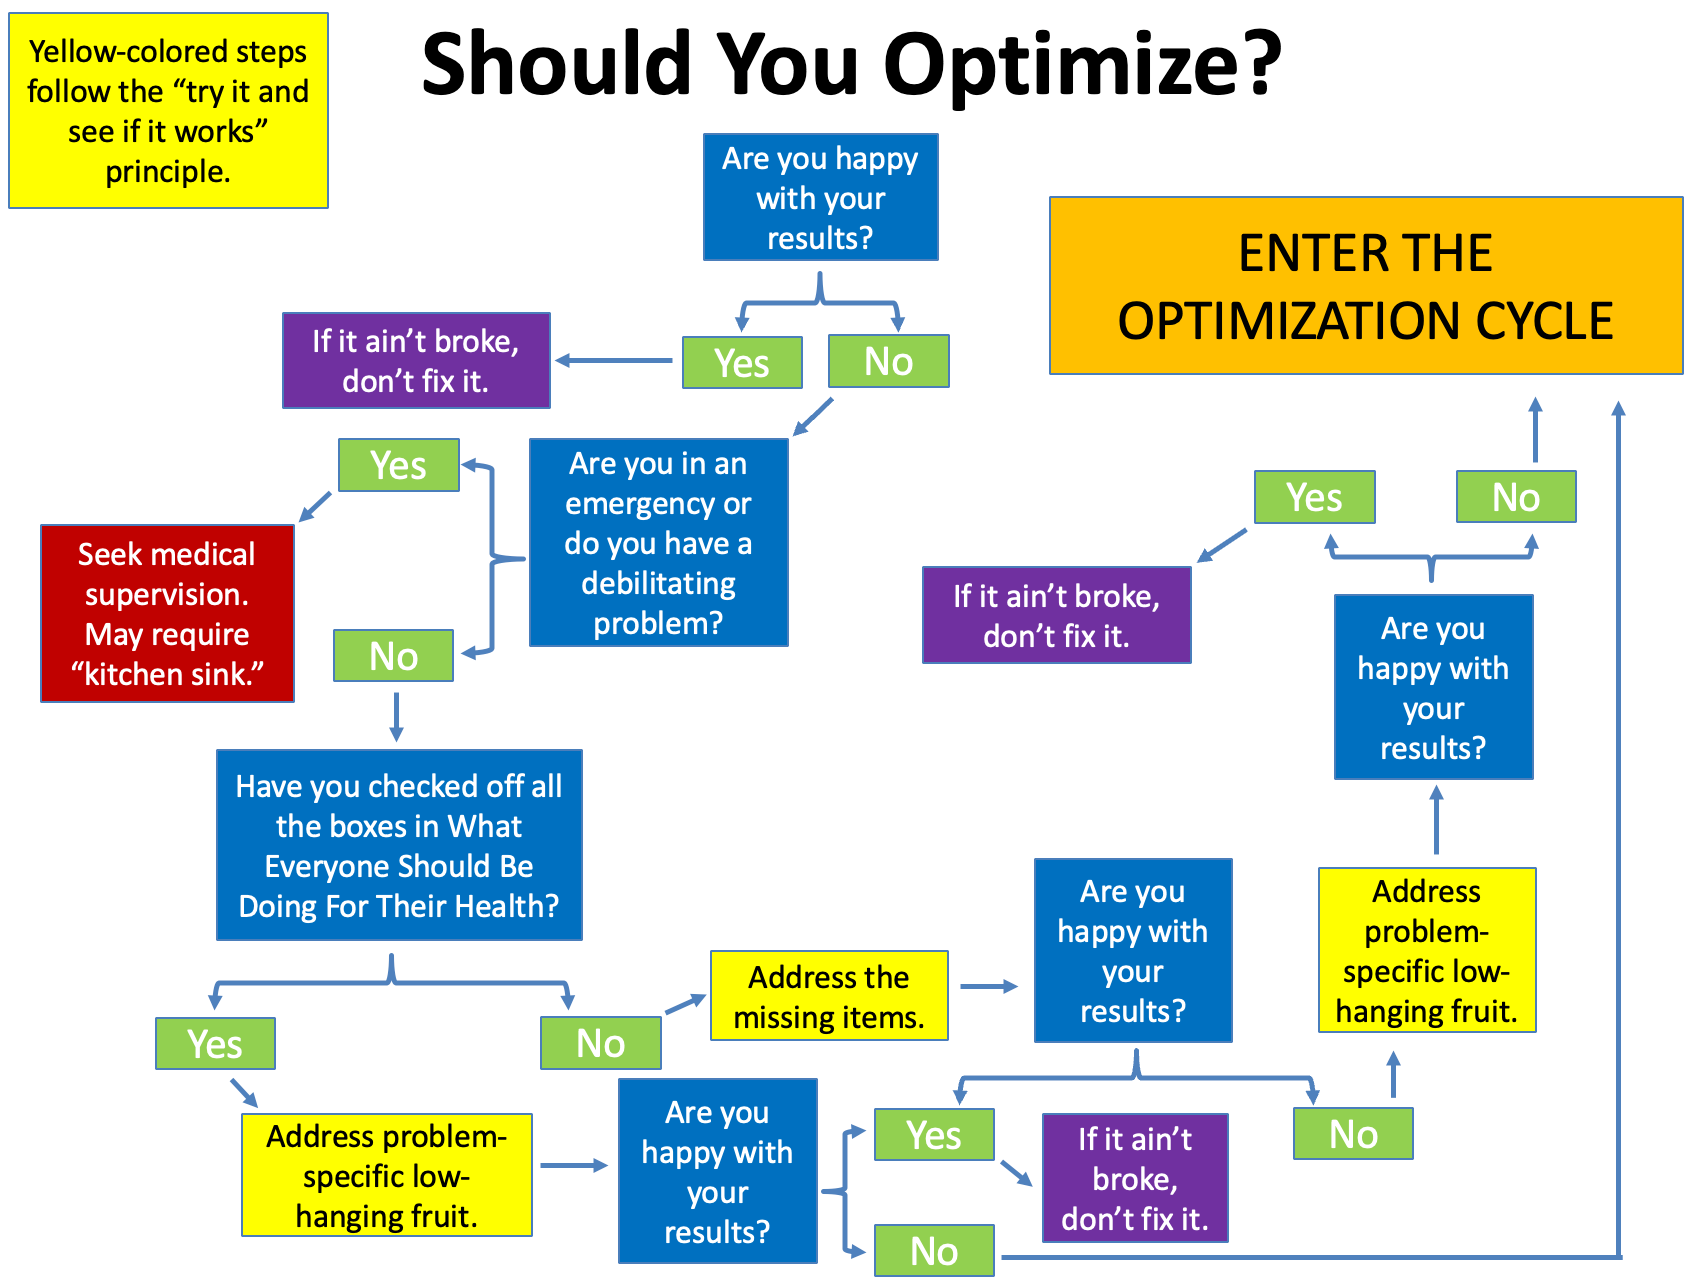
If you are checking all the boxes in What Everyone Should Be Doing For Their Health, are not in the middle of an emergency, and not suffering from a debilitating disorder that makes it impossible to safely take responsibility for optimizing, then you should consider whether you are happy with your results. If not, and if simply trying more low-hanging fruit does not give you what you want, it is time to optimize.
This is educational in nature and not medical or dietetic advice. See terms for additional and more complete disclaimers.
The Protocol Series
This is part of a series of protocols. See all of the protocols here:
Download the the Ultimate Guide
Or, read it below.
The Ultimate Guide to Optimize Anything
By Chris Masterjohn, PhD, 2025.
This applies to anything in life, but the focus is on implementing this strategy for health using any type of health-promoting strategy, whether it be foods, supplements, exercise, biohacks, herbal compounds, or pharmaceuticals.
This is educational in nature and not medical or dietetic advice. See terms for additional and more complete disclaimers.
This should be used as a framework for implementing any of my Protocols, and should be implemented after reading “How to Optimize Anything” to obtain proper context and detail and with examples to improve understanding.
How to Know Whether You Should Optimize
Use this decision-tree chart to decide whether optimization is the right strategy for you:
Define What You Are Optimizing
Define exactly what you want to optimize. Don’t rely on a proxy marker.
Rate Yourself On A Score of 1-5
If what you are optimizing is not already in the form of a number, turn it into one by rating yourself on a scale of 1-5.
Pre-specify the exact definitions of 1, 2, 3, 4, and 5. Hold yourself to these exact definitions throughout your optimization cycle.
Make your definitions such that you expect your first month of rating, if your health would remain the same as it has been, you would expect to hit an average of 3, but you would see at least a few 2s and at least a few 4s, but would not expect to see any 1s or 5s unless your health got substantially better or worse.
It does not matter whether you make the scale 1= bad to 5= great or the reverse. Pick whatever makes the most sense to you for what you are rating.
When you rate yourself, if you are unsure whether you should use one number or the one next to it, split the difference. For example, if you are unsure of whether you are a 3 or a 4, you are a 3.5.
Spend as much time as you need to pre-specifying your definitions so that you never have to think much about it again. When you rate yourself, spend no more than one minute doing it. Making it as easy as possible makes it sustainable.
Take Your Measurements Every Day
Take your measurements every day. In general, you should ignore the individual daily measurements and focus on the averages.
Never Second-Guess Your Data
If you question the validity of a data collection instrument you are using, perform a separate validation study according to the guidance of the manufacturer or according to whatever problem you believe needs to be addressed.
By contrast, never second-guess your data during the course of routine collection and measure it a second time just because you didn’t like or trust the first number. This introduces bias.
Collect Your Background Data
Your entire regimen should be characterized in one or several accessible places in case you need to cross-reference or extract some of that background data.
Your diet and supplements should be tracked in Cronometer.
Your workout should be tracked in an app like Jefit or an adequate substitute.
You may have other data that is intermittent, such as annual or quarterly lab testing.
All of this constitutes “Background Data.”
You may want to extract one or two background data variables to your optimization sheet to help with interpretation. You should do this if you think it is an intermediary (mediating the causal pathway between your strategy and your target) or a confounder (independently impacting your target making it hard to judge the impact of your strategy) and if it is variable enough to have an effect and if the variability is not so repeatable that its impact easily averages out over a few weeks.
Decide On the Strategy You are Testing
This could be one of the steps in any of my Protocols Series, or it could be something from ancestral traditions, something someone recommended, something that you found a scientific study supporting, or something you came up with yourself based on biochemical reasoning or intuition.
Download the Ultimate Optimization Spreadsheet
Download the Ultimate Optimization Spreadsheet here:
Do not open it in Excel or any other desktop program. Immediately drag and drop it into Google Drive and double click to open it as a Google Sheet.
Otherwise, features will be lost.
Self-rated variables are what you rate yourself on using a scale of 1-5.
Extracted variables are things you extract from your Background Data.
Glucose, ketones, and lactate are the key markers of energy metabolism you can measure at home, and you should measure your energy metabolism when you are in an optimization cycle because Energy Metabolism Governs Everything.
The sheet by default has three self-rated and two extracted variables alongside these three markers but you can use the sheet to track any eight variables without having to make complicated edits and the functionality will be preserved.
Make the following edits:
Change self-rated and extracted variable names to reflect the variables you are measuring.
For self-rated variables, replace each one’s name both in its data column as well as in its definition cell in the upper right, then fill in your succinct and precise definitions for 1, 2, 3, 4, and 5 for each of them.
Click on the top chart. Click … in the upper right corner, edit chart. Then click “include hidden/filtered data.” Keep the chart editor open and do this for the rest of the charts. It will now only require you to click once on the chart and then click once on “include hidden/filtered data” and keep doing this until you do it for the eighth and final chart.
Baseline Data
Enter “Baseline Data” into column A at the top. Collect baseline data for at least three days and ideally a week or more. The less familiar you are with how your variables of interest behave, the longer your baseline period should be.
Test One Thing At a Time
This does not mean test “one vitamin” at a time or test “one exercise” at a time. It means test one strategy at a time. It could be a multivitamin, a B Complex, an entire training approach, a program a new coach gave you, or a radical change to your food groups. Whatever it is, decide exactly what it means and test this and this alone until you can make a conclusion.
Slowly Titrate Your Dose To the Point of Maximum Benefit
Your dose range should be derived from my Protocols or from the existing knowledge base. If you are testing a vitamin or mineral with a well characterized requirement, use the dietary reference intakes (such as the RDA or AI) or my Custom Nutrient Targets as the lowest dose and make the rest of the range based on randomized controlled trials or associations between food-based nutrient intakes. If what you are testing is not of this nature, use randomized controlled trials, association studies, case series and case reports, and independent anecdotes.
Titrate up your dose in the same increment as your starting dose.
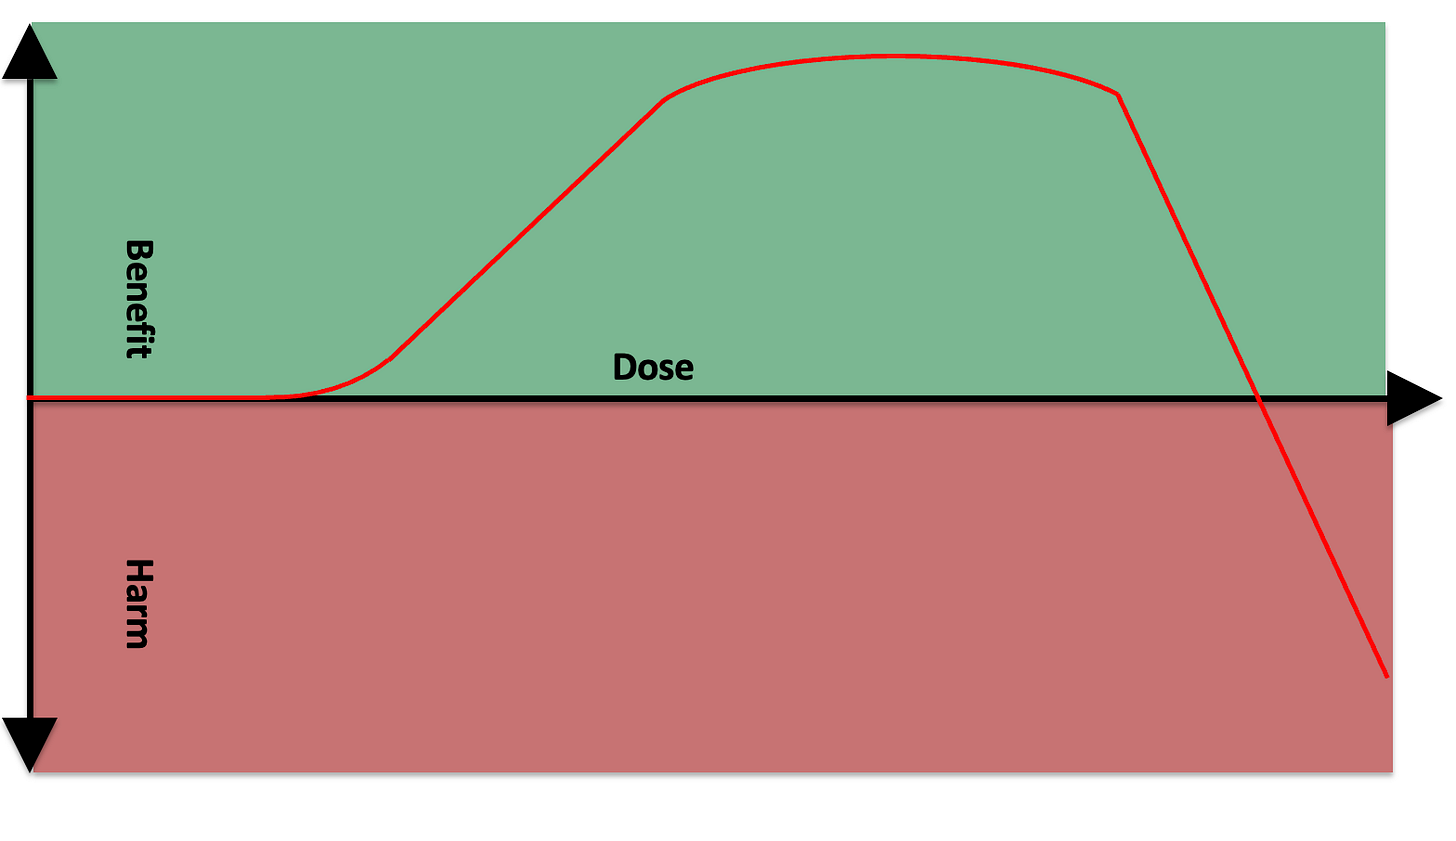
Assume that the “dose” of anything (exercise volume, frequency and duration of sauna, milligrams of a nutrient, grams of a macronutrient, etc) will have a curve associated with benefit and harm that looks like this:
You can divide up the main zones like this:
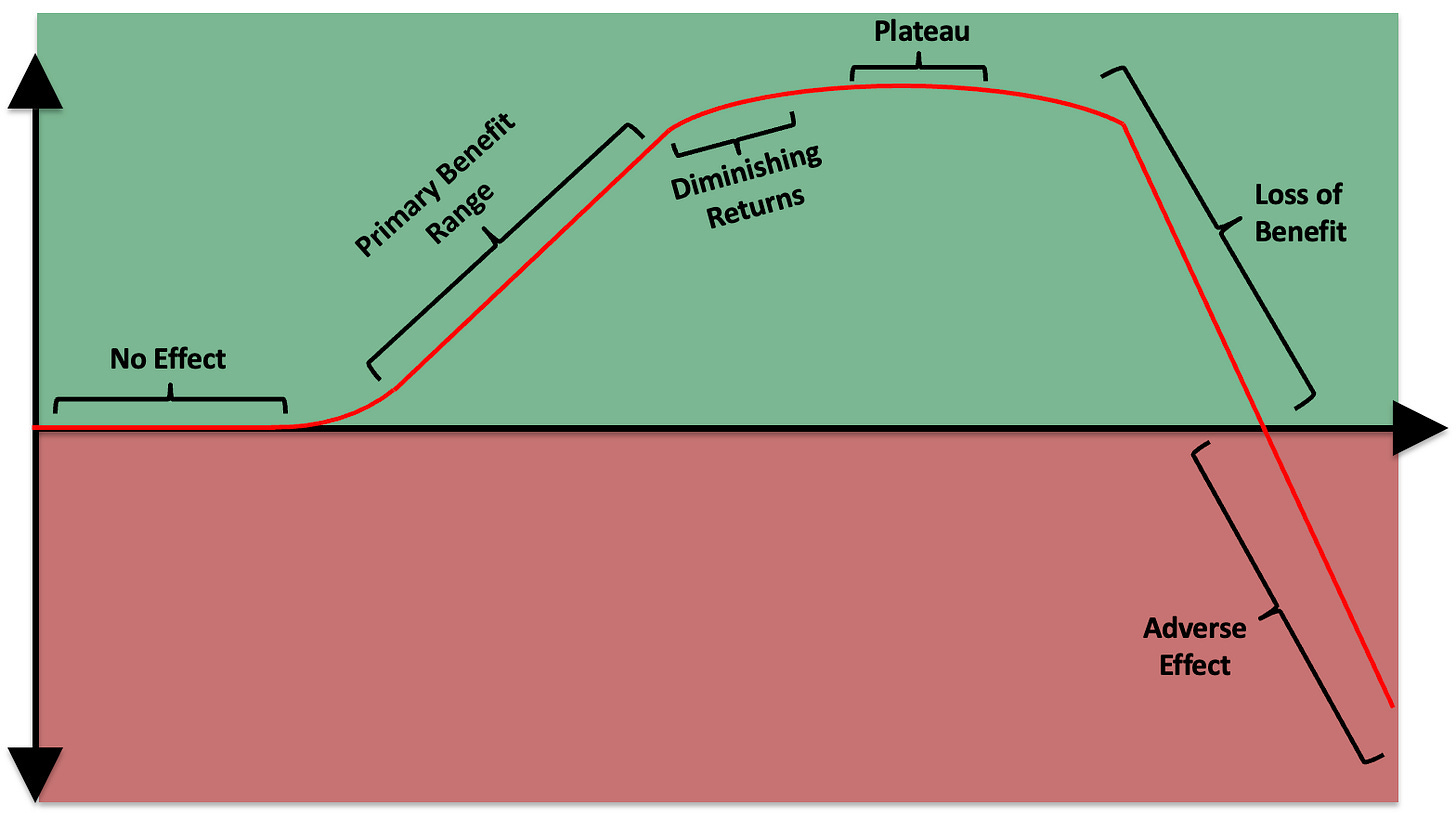
You want to be just shy of the point of diminishing returns:
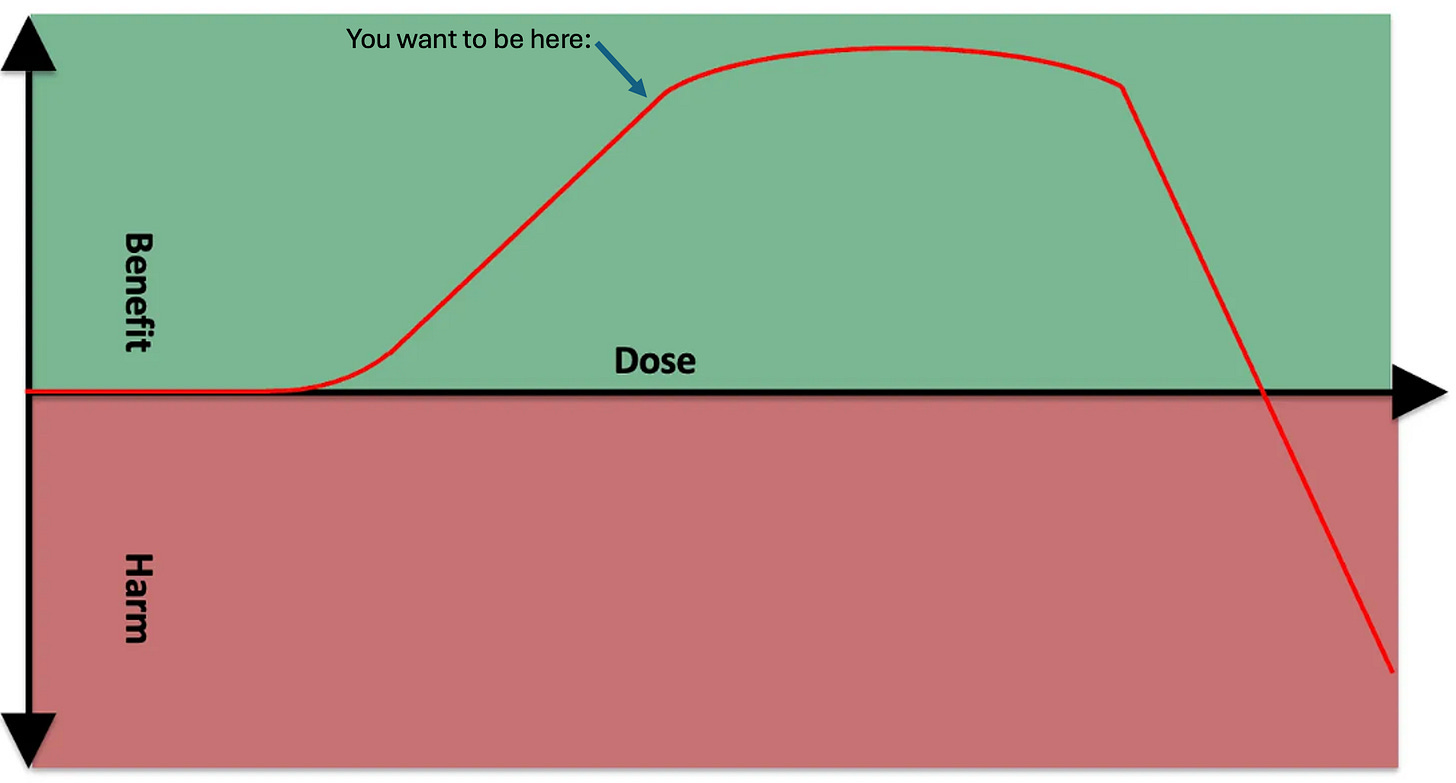
To get there, titrate up slowly until you experience a smaller benefit than you had obtained from earlier dose increases, then pull back to the last dose that had given you a big benefit.
If you add a strategy or increase a dose and nothing happens after a week, you can start moving more quickly until you see an effect. If the first effect you see is positive, you are at the bottom of the primary benefit curve and should titrate up until you find diminishing returns. If the first effect you see is negative, you are at the edge of the loss of benefit or adverse effect range and you should cut the dose down until you find a dose that provides a benefit without an adverse effect. If you cannot find such a dose, discard the strategy.
How Long to Spend At Each Dose
Give at least a week to see if an effect emerges.
If you see an effect, stay at any given dose until your variables of interest stabilize.
You know you have stabilized when the moving averages are all clustering together in a straight line, and the short-term data is not breaking out of this cluster indicating a new emerging trend.
Once you stabilize, you can move on to the next dose increment or to the next strategy.
When to Randomize
If you initially think you see a benefit but over time it seems to wear off or act inconsistently, you may benefit from performing a randomized controlled trial on yourself.
If the effect you think may be there is definitely worth knowing about, characterize the time for which you would have to conduct the trial.
Assess your observational data for the possible existence of a lead-in effect, which is the time for the benefit to onset or reach a stable point, and the possible existence of a washout requirement, which is the persistence of the benefit from some period after you stop the strategy.
Your randomized periods will need to include the part you are measuring plus a buffer of lead-in and washout if you determine that lead-in and washout periods are necessary.
Plan to randomize at least six pairs of trials, so that you have twelve total trial periods.
The old approach is your control, and the new approach you are testing against it is your intervention.
Your primary endpoint is the thing you are optimizing.
Calculate the average and standard deviation of your control and intervention period from your observational data.
Use a sample size calculator to see how many pairs of trials you need to randomize. Whichever period had a greater standard deviation, enter its mean and standard deviation for group 1. Enter the other mean for group 2. Hit “generate.” The number per group in the result is the number of pairs you are going to randomize. If it seems impractically high, make a rule that you will analyze your data at the exact half-way point. If it is convincing you will stop. If you are unsure you will finish the trial.
Use a coin flip or a random number generator set to a minimum of 1 and a maximum of 2. Establish two orders you are testing: control then intervention, or intervention then control. Assign each order to heads or tails, or to 1 or 2. Make a rule that all orders have to be used more than once. Use the coin flip or the generator until one of the orders has already been used for half the slots, then fill in the remainder with the opposite order so that they all get used the same number of times.
Note in your sheet the occurrence of the trial and which day belongs to which order, but make a separate sheet or tab where you organize everything by the trial design.
Run stats with Graphpad t-test calculator set to “enter or paste up to 2000 rows.” If your pairs were subject to a variable in a way that makes each pair more closely related than the non-paired trial periods (such as being conducted across a menstrual cycle or a period of linearly increasing vitamin D status), you can use a paired test, but you have to enter your data in the exact paired form. For example, if you randomized pairs of ten-day periods, you have to enter the average for each 10-day period rather than the daily data, and each member of a pair has to be in the same slot in each column so the pairs are side by side. If pairing is not indicated, you can enter your daily data and do not need to worry about the organization so much.
It will give you a two-tailed p value. If you had a very specific hypothesis of the data going one way and not the other such that you would be willing to forego the knowledge that it had truly gone in the opposite direction, you can cut this p value in half to arrive at a one-tailed p value. The p value is the likelihood that you would observe a difference of this value or greater had no real effect been present. Conventionally, less than 0.05 is significant, but this is arbitrary. This gives you a sense of how confident you can be that your effect is real. You are only trying to prove it to yourself so you can be somewhat liberal with your interpretation of the data.
Forming Your Conclusion
You can also use the t-test calculator to test differences in your protocols.
Ultimately you want to look for whether the size of the effect is worth whatever cost is associated with obtaining it, and if you are convinced, incorporate the strategy into your long-term protocol and move on.
When You Are Done Optimizing
You are done optimizing when you get the results you want or you are out of strategies.
If you have the results you want, pick a new optimization target, or exit the optimization cycle until you feel the need to enter it again.
If you are out of strategies, take a “deload” period from optimizing, then focusing on learning until you have found new things to try.
Staying Optimized Over the Long-Term
When you have optimized something, continue to track it or at least check in with it from time to time to keep it optimized. If you think something that worked before is now causing a problem, or is not necessary, use this optimization strategy to slim down your regimen. Intersperse periods of reflection on what you want to stay optimized so your optimization stays high-return.
For biohackers and other outliers, I don't think "if you're happy with your results" or "if it's not broke, don't fix it" are within our paradigms lol. Is it optimized? No? Then optimize. Iterate. Repeat! Are you satisfied with 80/20 results? No? Repeat!