


COVID-19: How Much Worse Will This Get Before It Gets Better?

I want nothing more than for the COVID-19 crisis to be over as fast as possible, but it's important to look carefully at the data and be realistic in order to do our best in arriving at a solution.
Several preprints* were released this weekend that, together, suggest three things:
On the bright side, the social distancing policies are effective at taking us away from the stage of exponential growth.
On the downside, the transition from exponential growth is not to a period of declining cases and deaths, but to a linear growth of cases and deaths. This linear phase is where the number of new cases and deaths each day remains largely constant, leading to a linear accumulation of total cases and deaths.
The good news from this is that if social distancing policies are implemented earlier rather than later, the linear phase will have a much lower number of new cases and deaths each day. Since many communities do not have active outbreaks yet, but most will have them soon, many communities can still act to prevent things from getting as bad as they are in places like New York City, where I currently live.
Let's take a look at the data.
Most Cases Are Undetected
Researchers from Harvard and MIT released a preprint estimating how many cases likely go undetected in the United States using data from Iceland.
The paper used data up through April 2, at which point almost 21,000 Icelanders, about 6% of the population, had been tested.
Iceland has two testing systems:
One is run by the healthcare system, targeting individuals with severe symptoms or at high risk based on contact with infected individuals or travel to high risk areas.
The second is run by the company deCODE Genetics and is voluntary and open to anyone not under quarantine and not tested by the healthcare system.
Iceland’s health care systems’s guidelines are similar to CDC guidelines. So, the researchers estimated who gets missed by CDC guidelines based on who gets missed by Iceland's health care system but gets picked up by deCODE.
The deCODE testers were not a random sample of the population. In fact, 44% had symptoms of cold and flu, which is much higher than would be expected. As a result, the people who volunteered for testing were probably more likely to have COVID-19.
They dealt with this by performing several analyses, including one that excluded anyone with symptoms. When they did this, they estimated that at least 88.7% of COVID-19 cases go undetected by CDC criteria. When they included the people with cold and flu symptoms, they estimated that 92.5% of COVID-19 cases go undetected by CDC criteria.
These are similar to results published earlier from Wuhan suggesting CDC criteria would miss at least 85% of cases.
Overall these results suggest that only about one in ten cases of COVID-19 get detected in the United States.
Of course, the true rate would require testing in a random sample of the population. Such testing is underway in Iceland, Germany, and Norway.
For now, the one in ten figure makes sense.
Asymptomatics Can Transmit Infection
A researcher from the University of Aukland, New Zealand, released a review of papers documenting asymptomatic transmission.
He identified nine relevant papers. Most of them just document the existence of people who test positive for COVID-19 but do not have symptoms. One woman had lung damage from COVID-19, despite never experiencing symptoms. Several were asymptomatic yet had clusters of infected people in their family. 30-67% of people infected on the Diamond Princess cruise ship were asymptomatic.
These simply show that many people who are infected are asymptomatic. The most compelling case of transmission among those listed seems to be a woman from Shanghai who had no symptoms, but appeared to infect four people at a business meeting in Germany.
Personally, I find it very difficult to believe that asymptomatics cannot spread the infection. The Nature paper showing the virus infects the throat found that viral loads in the throat were already declining on the first day of symptoms. People should be most infective when they have the highest viral loads in their body fluids. If the highest viral loads of the upper respiratory tract occur prior to the start of symptoms, it seems almost certain that people start spreading it before they have any symptoms.
72% of Counties in the US May Be Undergoing Outbreaks Right Now
A third preprint was released by researchers from the University of Texas at Austin.
These researchers estimated the likelihood that US counties had outbreaks right now that were below the radar of the community.
They made three key assumptions:
Only one in ten cases are detected (this is supported by the Iceland data I described above.)
The number of people that can be infected by each person, the reproductive number or R-naught, has declined from 3 to 1.5 as social distancing policies have cut human interactions within the US down by an average of 50%.
Each county has at least one undetected COVID-19 case.
Obviously each of these assumptions is debatable. But the assumptions need to be made to make a workable model. Using them, they estimated the following:
If a county has no detected cases, there is a 9% chance an outbreak is underway.
With a single detected case, there’s a 51% chance an outbreak is underway.
Overall, 72% of US counties covering 94% of the national population have a more than 50% chance of an outbreak underway.
As I wrote last week, data from Washington State suggest the virus circulated through the community for 4-6 weeks before the first community-acquired case was detected.
This suggests that the vast majority of US counties will have outbreaks if they don't have them already, and that many of the outbreaks that are brewing now will not materialize for another few weeks.
Using Ebola Data Suggests a Leveling Off, But Should We Use Ebola Data?
Two researchers from the University of Minnesota released a preprint where they suggested a leveling off was about to occur in the US. They used a statistical model that performed very well in predicting the leveling off of Ebola before it happened, and they assumed we are getting close to the flat top of an S-shaped curve. Here they show that China fits this data and the US is about to:
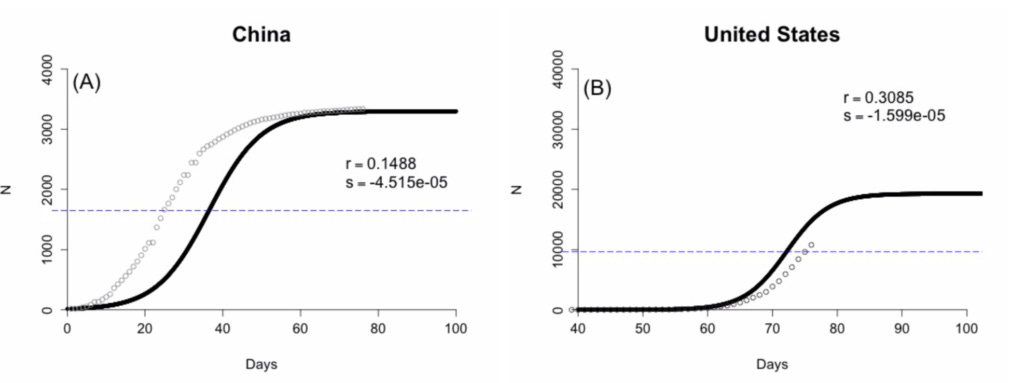
There are two problems I see with this approach:
First, Ebola doesn't have anywhere near the transmissibility of COVID-19. As reviewed here, there is no evidence of asymptomatic transmission, and the risk is low with casual contact; human-to-human transmission mainly occurs through direct contact of mucous membranes with the body fluids of the infected person.
Second, the US data doesn't actually fit the curve yet at all. The top of the S curve is completely imputed from the assumptions. The only example matching the model is China.
As discussed in the next section, a much better model fitting the data for most countries is a transition from exponential growth to linear growth.
Social Distancing Triggers the Transition From Exponential to Linear Growth
The fifth and final of this weekend's preprints I will review here is a paper released from researchers in India.
They suggest a model where the institution of strict social distancing transitions a society from a curve of exponential growth to a curve of linear growth. Here is their model applied to the Lombardy province of Italy:

If the growth of cumulative cases were simply linear, it would follow the dark black dotted line and would have started just before March 16. If it instead followed an exponential curve beginning when it actually began, on February 23, it would follow the blue dotted line. Instead, it followed the red line. The red line traced well along the exponential curve until the lockdown; about ten days after the lockdown, it began tracing well with the linear curve.
Their model replicates in the Veneto province of Italy, the Bayern and Baden states of Germany, South Korea, Singapore, Saudi Arabia, Spain, Germany, and Switzerland.
China is the only exception that seems to have entered a period where no new cases are reported. However, many doubt China's figures, including the CIA.
They explain the trend as follows:
Initially, the growth is exponential, because the number of people who are infected dictate the number of people who can cause infections in others. If each person can infect several people, then as the number of infected grow, the number of people who can be newly infected each day grows with it. Like compounding interest.
Since undetected transmission may occur for ten days or so before someone has symptoms, gets tested, and gets a positive result back, social distancing policies take about ten days to initiate their true effects.
In a perfect quarantine, new cases would slow down and cease. However, any realistic quarantine measures have leaks. These leaks are more likely to happen when there is asymptomatic transmission, because someone can get infected and not realize that they should be taking any measures to protect the people around them. A small leak in the quarantine can allow each infected person to infect one other person. That will lead to a constant rate of new infection. When plotting the cumulative cases over time, it will result in a straight upward line.
While the model of transitioning from exponential to linear growth occurs across many societies, the slope of the line varies greatly. For example, the number of new daily cases during the linear phase has been 50 in Singapore, 100 in South Korea, 980 in Switzerland, 4200 in Italy, 5600 in Germany, and 7600 in Spain. The key determinant of the growth during the linear phase is at what point the society left the exponential curve. The earlier, the better.
One of the points they make is that to see the true relationship, we need to break the data down to the level of the community in which the cases are freely diffusing. For example, if there is a hotspot in NYC and another in New Orleans and another in Los Angeles, looking at the trend in the United States overall will just muddy up the data.
Data from NYC Are Consistent With the Model
Up-to-date data for NYC can be found here. In the following figures, we must keep in mind that the last seven days are incomplete and should be disregarded. Note also that these are new cases each day, and the graphs in the paper above plotted cumulative cases.
Here are the cases:

The relevant timeline:
CUNY and SUNY shut down on March 11. Restrictions on mass gatherings started on March 12. On March 16, the states of NY, NJ, and CT closed all movie theaters, gyms, and casinos. On March 20, the state closed all “non-essential business.” The new cases should flatten out ten days after these go into place, so we should see it emerge between March 22 and March 30. Data are only complete up to April 5. Although the data are noisy, it's clear the new cases were growing each day through March 20, and they seem to have leveled off by March 27.
Here are the new deaths each day:
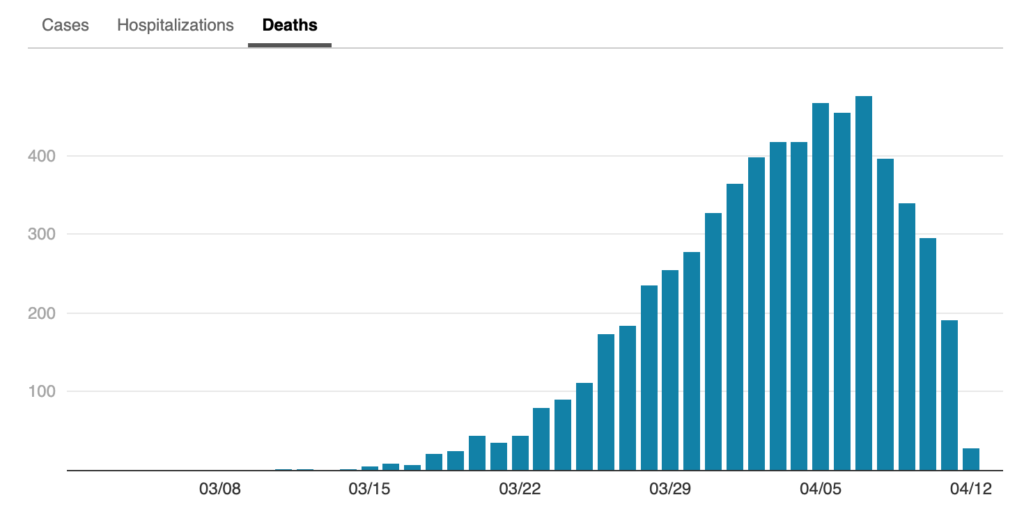
The deaths follow a steep upward trend at least until April 5, the last day we can consider the data complete. It's possible they have leveled off since April 5, but it won't be clear if that is true for another few days.
The deaths stick to their rapid increase some 9 to 16 days after the cases level off, reflecting the fact that can it take two weeks from diagnosis to reach critical condition.
The leveling off of the cases is hardly comforting when the deaths have yet to clearly start declining. Anyone working in the context of the NYC crisis is surely wishing the city had acted sooner. Yet the cases only emerged onto our radar some ten days before the strict policies were initiated.
The leveling off of cases to a similar number of new ones each day is consistent with the transition from exponential to linear growth. This suggests that we will see the death toll stay where it is now for at least two weeks, and that we won't start seeing it level off until about two weeks after the new cases start declining.
The Bottom Line
Given that many communities who do not yet have an outbreak on their hands likely have one brewing, that the exponential growth phase in these communities is likely already underway, and that the best protection against a high death toll during the post-social distancing linear phase is to leave the exponential phase as quickly as possible, I believe these data support everyone doing what they can to minimize person-to-person spread even if they have no symptoms and are in communities with no documented outbreaks.
Many people question the importance of this outbreak, and suggest that these are just people dying who would have died anyway from something else. The New York data invalidate this idea.
The last year for which NYC mortality data are complete is 2017. There was an average of 147 deaths per day. There are now over 450 deaths per day due to COVID-19 alone, more than three times the expected total mortality rate.
What is happening in NYC now reflects what happens on the other side of the exponential curve. We exited it and are in the linear phase. We are happy to be exiting the exponential phase, but this linear phase is not a good place to be.
The good news that comes out of this is that we can have a huge impact on the nature of the linear phase by being proactive very early in the exponential phase. Taking this seriously before it seems like a major threat in our backyard is the most powerful choice we can make to keep the burden from becoming overwhelming later on.
Stay safe,
Chris
Please Support This Service
These research updates are made possible by purchases of The Food and Supplement Guide to the Coronavirus. The guide contains my most up-to-date conclusions about what we should be doing for nutritional and herbal support on top of hygiene and social distancing for added protection. Due to the absence of randomized controlled trials testing nutritional or herbal prevention, these are my best guesses for what is likely to work without significant risk of harm, based on the existing science. Purchasing the guide is also a way to donate $9.99 toward this service of providing free research updates, as the financial support provided by the guide is what enables me to spend time staying on top of the research.
Disclaimer
I am not a medical doctor and this is not medical advice. I have a PhD in Nutritional Sciences and my expertise is in conducting and interpreting research related to my field. Please consult your physician before doing anything for prevention or treatment of COVID-19, and please seek the help of a physician immediately if you believe you may have COVID-19.
Subscribe
If you aren't subscribed to the research updates, you can sign up here.
Archive
You can access an archive of these updates here.
Comments and Questions
To leave a comment or question, please use the Facebook post for this newsletter.
*Footnotes
* The term “preprint” is often used in these updates. Preprints are studies destined for peer-reviewed journals that have yet to be peer-reviewed. Because COVID-19 is such a rapidly evolving disease and peer-review takes so long, most of the information circulating about the disease comes from preprints.